Original author: 0xPhillan
Original author: 0xPhillan
Original source: web3edge
Original translation: old yuppieDune is probably the most powerful blockchain data analysis tool currently available to the masses, and best of all:free!
With Dune, you have near real-time access to blockchain data through a public database that can be queried using SQL.
This is very powerful energy.
Dune decodes blockchain data before adding it to the database, which means you don't have to figure out the bytecode yourself. Instead, you can use Dune's browser to browse datasets, specific smart contracts, events, or calls!
Dune recently released the V2 engine, which improves performance by 10 times, now is the time for you to learn how to use Dune.
In this guide, you will learn:
Part 1: The Dune interface
Part 2: Build your own queries and graphs using SQL - starting with the basics
Part 3: Organize everything into dashboards
let's start!
first level title
Inquire
dash board
Inquire
fork
fork
query editor
Dataset browser and data classification
Save your forked query
Part 2: Build your first query
decide which queries to build
looking for the right information
Ready to build your first query in Dune
Query 1: Funds raised in ETH
Query 2: Funds raised in USD
Query 2a: Fundraising in USD at current ETH value
Query 2b: Fundraising in USD in terms of ETH value at time of purchase
Query 3: Total number of supporters
Query 4:
Query 4a: leaderboard using erc721. Abstraction
Query 4b: leaderboard using poolysupporter. decoding table
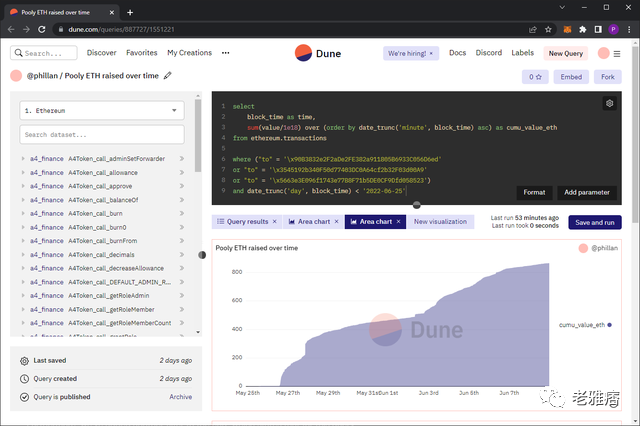
Query 6: Time series graph of ETH raised over time
Part 3: Cleaning up the Dashboard
Finish
secondary title
Part 1: Dune and Features Overview
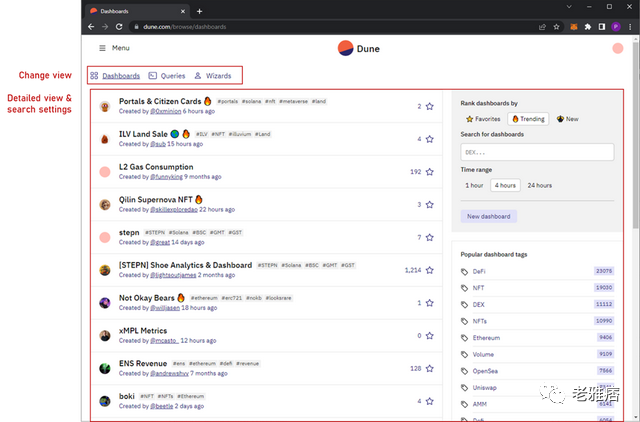
When you open the Dune.com website for the first time, you will see the window below. There is a view changer at the top of this window that lets you cycle through dashboards, queries and wizards, and then a detail view area where you can see a list of dashboards, queries and wizards (users) on the left and some searches - right Side related settings.
Dashboard
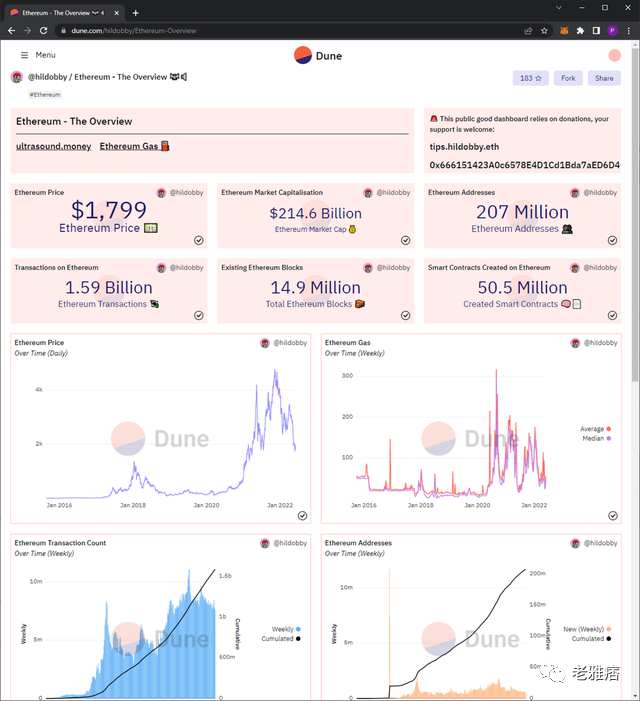
In Dune, every dashboard is public. This means anyone can view and copy everything you build, or anyone else builds! This drastically reduces dashboard creation time and lets you learn from other users' queries.
Inquire
If you remember, I mentioned that a dashboard is a collection of queries. If you click on the title of any dashboard element, you will be taken to the SQL query for that chart:
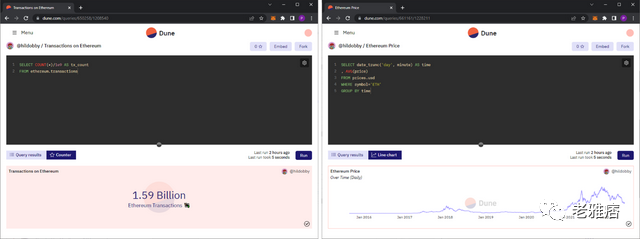
image description
Two examples of dashboard query editor screens
Here we can see two main elements on the screen: the query (top; black box) and the output graph (bottom). That's right: no matter which tile or chart you click on, you can see how the user created that chart.
If you want to save the entire dashboard or just the graph query to your own account, you can click "Fork" in the upper right corner and everything on the forked screen will be copied to a new window where you can edit and save the view to your account.
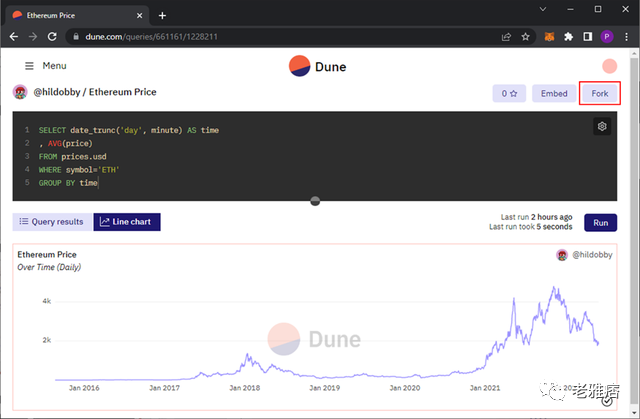
image description
Ethereum price query
Let's fork the Ethereum price chart! After pressing "Fork" on the query, you will be taken to the query editor with the previous code copied in!
query editor
Let me introduce you to the various on-screen elements here:
Query location and name - name can be changed after clicking save!
Dataset Browser - search for a specific dataset
Query window - enter your SQL query here
Visualization selector - choose whether to view query results, forked line charts, or create new visualizations
run - run the query in the query window
save - Save your (forked) query!
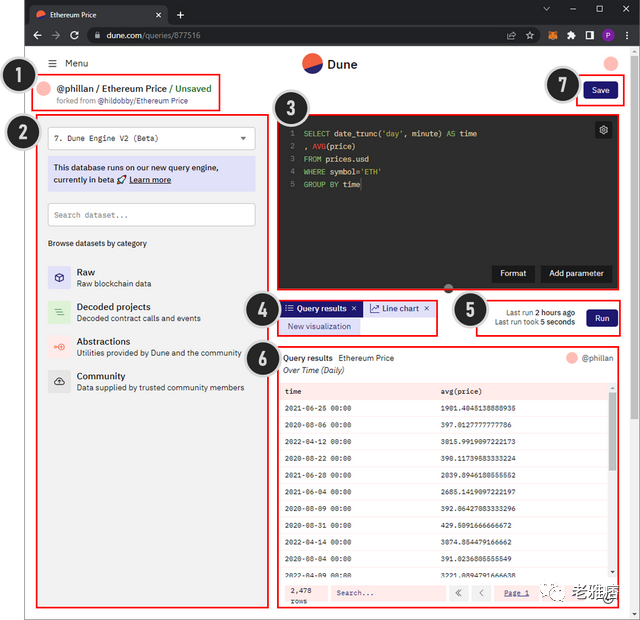
image description
Dune Query Editor Overview
Dataset browser and data categories
Let's take a closer look at the dataset browser. There are six functional areas in the dataset browser:
chain selection
Dataset Search
Browse raw blockchain data
Browse and decode contract data
Browse data provided by the community
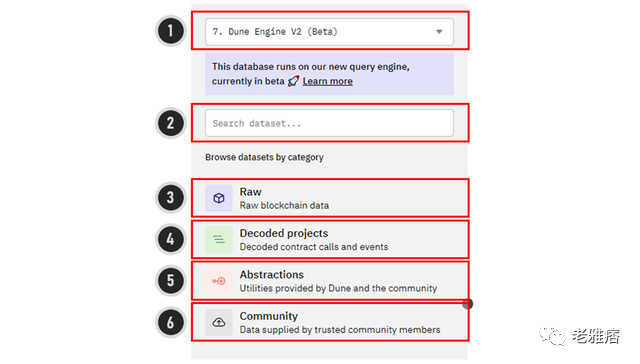
image description
Dune Dataset Browser Overview
In dataset selection, you can choose which chains you want to parse. Selecting "Dune Engine V2 (Beta)" gives you access to Dune's latest enhancements, which include multi-chain queries and a 10x performance boost.
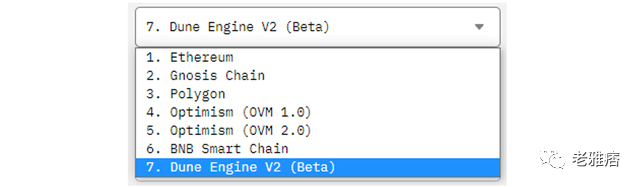
image description
If you select another chain, the category selection (items 3-6 in the image above) will disappear and you will see a list of contract calls and events that you can interact with.
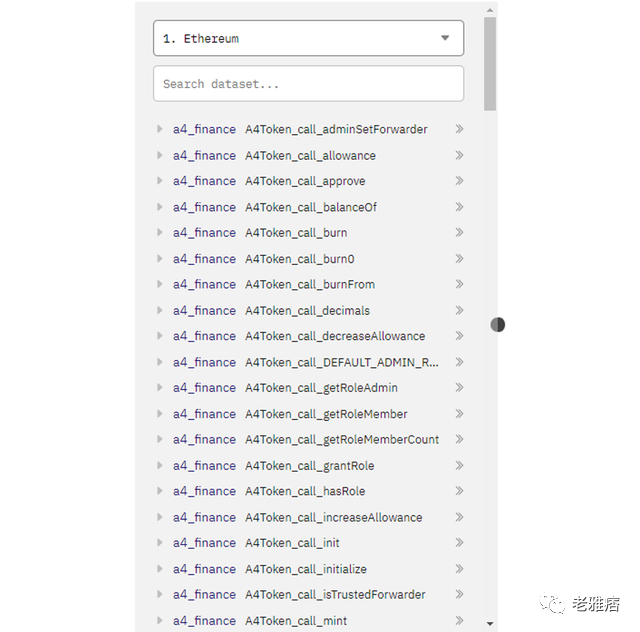
image description
Select "1. Ethereum"
search
Note: Dune Engine V2 and the old search function return results differently. Whereas the old search returned a list of all results, Dune Engine V2 returns a nested list of results. We'll be using the V2 engine!
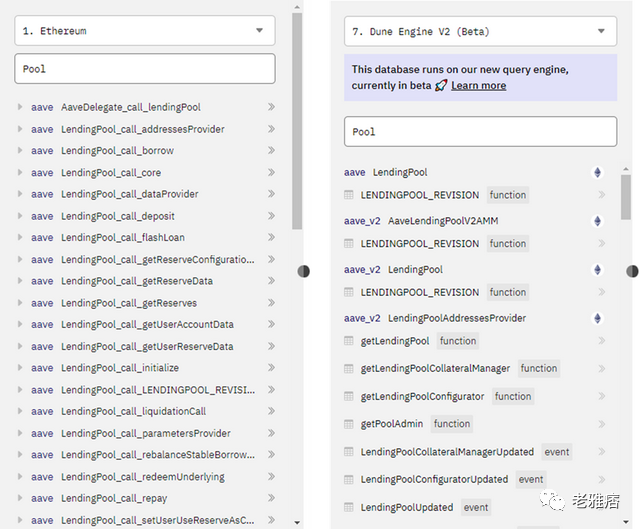
image description
Search results for "1. Ethereum" and "7. Dune Engine V2 (Beta)"
If you click on the raw blockchain data, you can easily find queries for the various blockchains that Dune supports in the nested data structures, by first selecting the raw table, and from there selecting the specific table columns you want to investigate further. Within each nesting level, by selecting, you can also filter for the specific search results you are looking for.
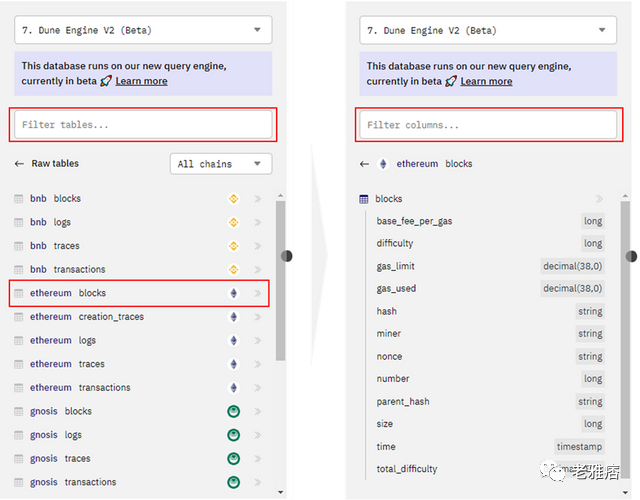
image description
Dune Engine V2 (Beta) Raw Blockchain Data Overview
This is a very quick and easy way to get advanced blockchain data.
decode item
You'll notice again that the search results are nested. At the highest level, there are projects that you can search, at the lower level, you can filter for a specific smart contract within that project, and finally we see the various tables generated from that smart contract. If you click on any table, you will see a list, just like the original blockchain data.
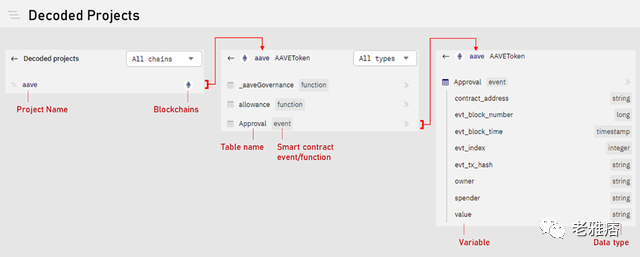
Dune Engine V2 (beta) decoding project overview
Summary
Summary
A summary can be thought of as a custom table that joins and combines various queries and data blocks to form a unique table. Summaries help users more easily query the specific data they are looking for without having to manually combine various data.
In general, summaries can be divided into two categories:
Sector Summary: Sector-specific data
From the Summaries submenu, you can see a list of summaries with tags that specify whether the summaries are department-specific or project-specific.
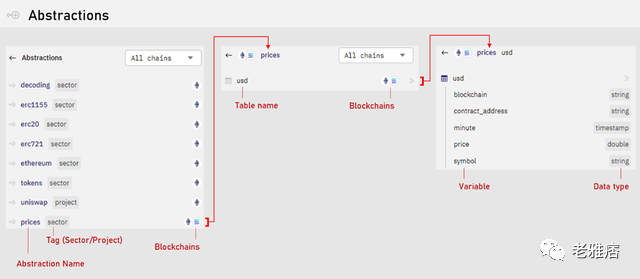
Dune Engine V2 (Beta) Summary Overview
Community
Community
You might be wondering why there is only one entry in the community section ("flashbots") - that's because Dune Engine V2 has just been released! Over time, we can expect to see more and more community datasets built by trusted community members.
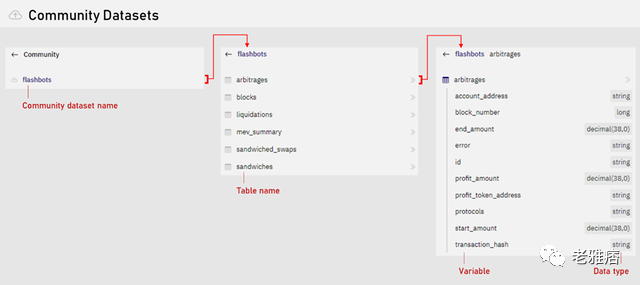
image description
Dune Engine V2 (Beta) Community Overview
In the image below, you can see a summary of how the data in Dune has been aggregated since the release of Dune Engine V2: the four main data categories are raw blockchain data, decoded items, summaries, and communities, which hold various A blockchain data that can save various data types.
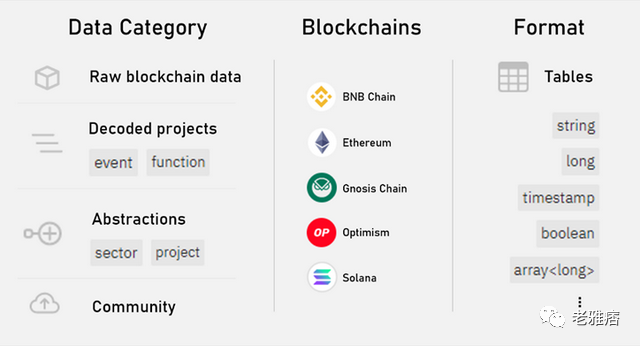
image description
Overview of tabs in the Dune Engine V2 (beta) data browser
Let's save this query first. After clicking save, a few things happen. First, give your query a name.
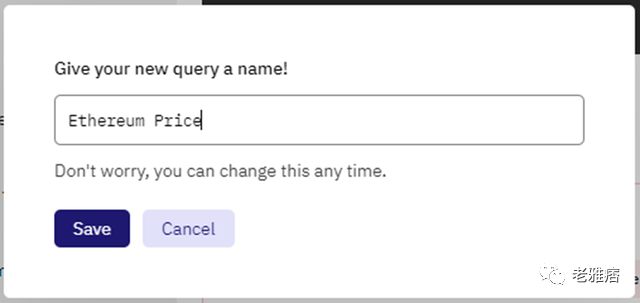
image description
Save query popup
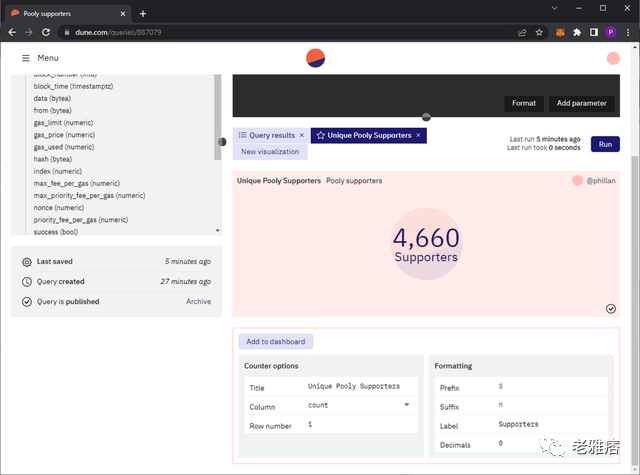
(1) The query location and name are updated, and (2) your query is running. This means Dune is getting the latest data from their database, which is regularly updated with the latest data from various blockchains. After the query finishes running, you'll see the query results (3).
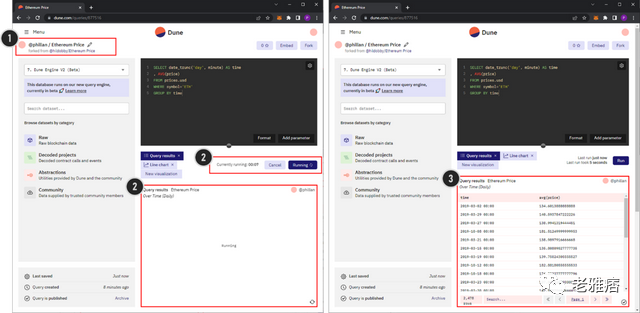
image description
From here, if you click on any of (1) Query Results, Line Chart, or New Visualization, the (2) Results/Visualization box will update with (3) the selection settings displayed below it . Here, there's also an "Add to Dashboard" button to quickly add your query results or visualizations to a new or existing dashboard - just like @hildobby's Ethereum dashboard before!
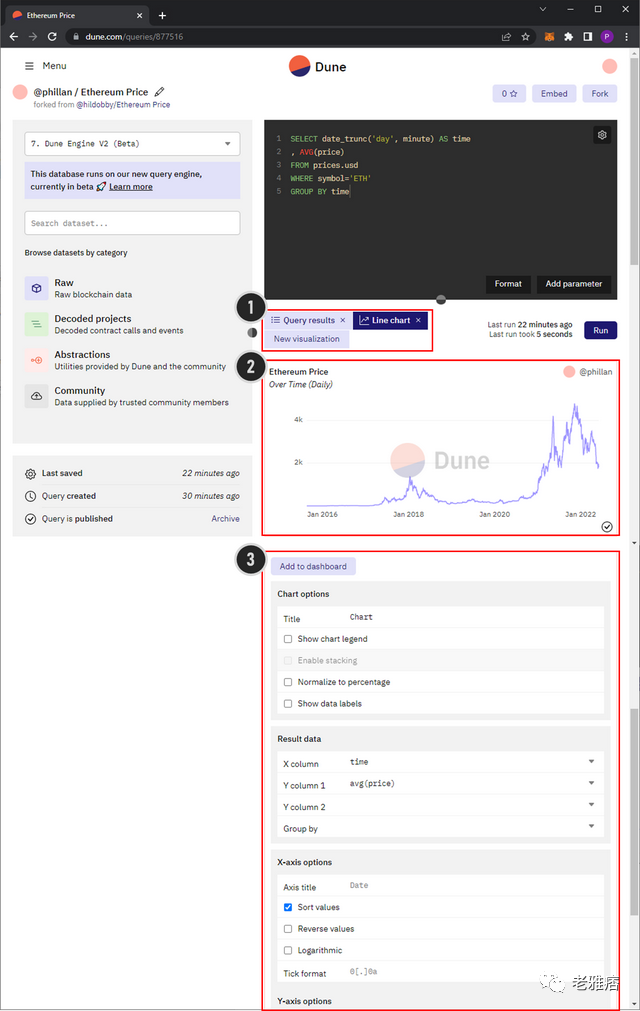
image description
If you click (1) the circle in the upper right corner and then (2) "My Queries", a list of inquiries for your account will open.
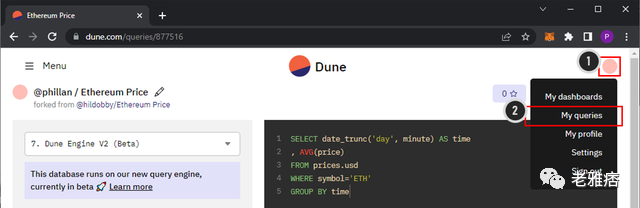
image description
The query list includes all queries you have ever saved in your account. In the top screenshot below, we can see the latest query created:
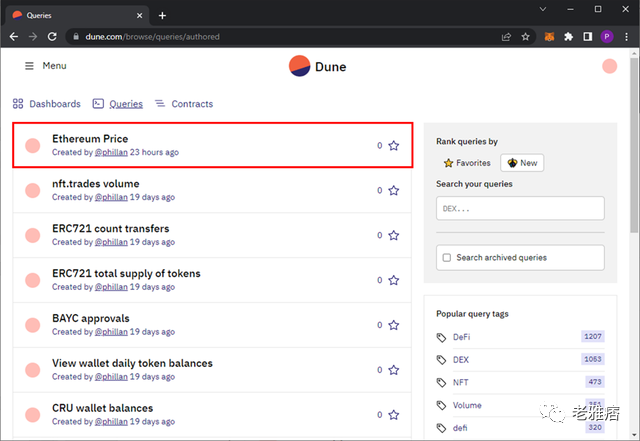
image description
A list of queries with the most recent queries is kept at the top
Congratulations, you've learned to use visual forking and saved your first query!
Let's get our hands dirty and build a dashboard—a collection of queries and visualizations—from scratch, without forking. This part will teach you where to find the correct blockchain details to look up for your specific project, and teach you the basics of SQL.
first level title
Part 2: Build your first query
The purpose of this section is to teach you:
How to find the correct information you need for a specific project
But first, we need to decide what the dashboard is for. The Pooly NFT of the Pool Together DeFi protocol is the first step.
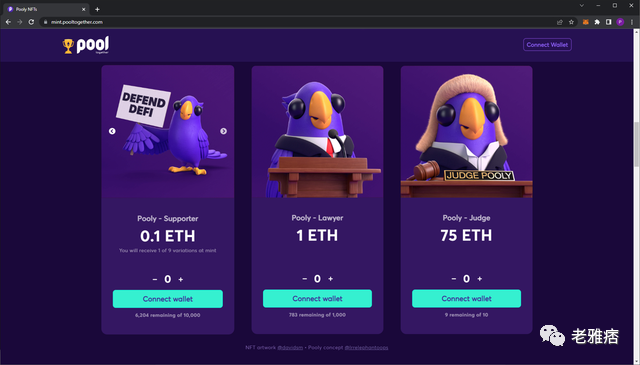
image description
If we search for "Pooly" on Dune, sure enough, we can find some Pooly NFT trackers created by the community.
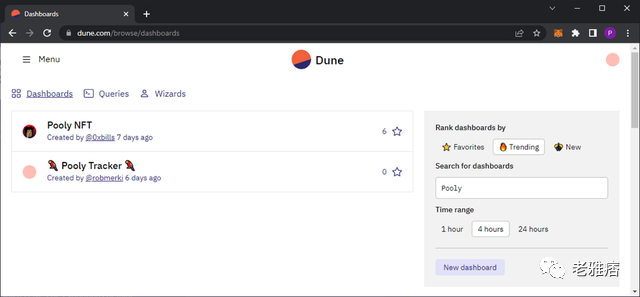
image description
We can click on one of the Pooly dashboards created by @0xbills and click "Fork" to get to work...
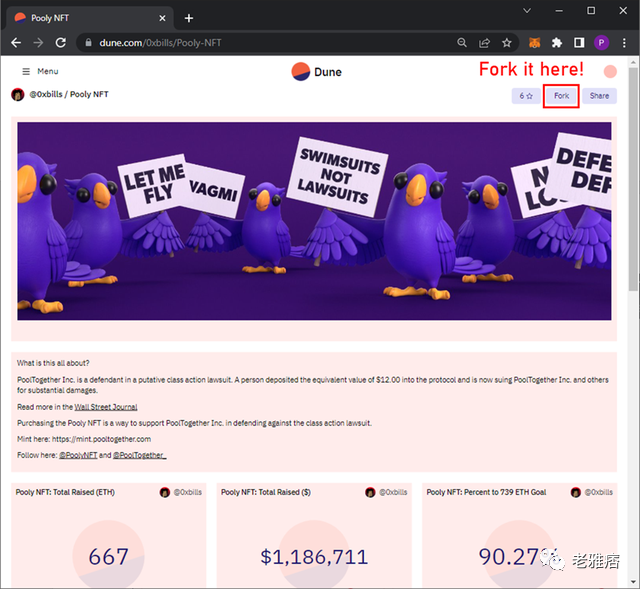
image description
@0xbills via https://dune.com/0xbills/Pooly-NFT
But if we build it from scratch, we'll learn how to be a blockchain detective and learn some SQL at the same time! Therefore, we need to build our own query from scratch.
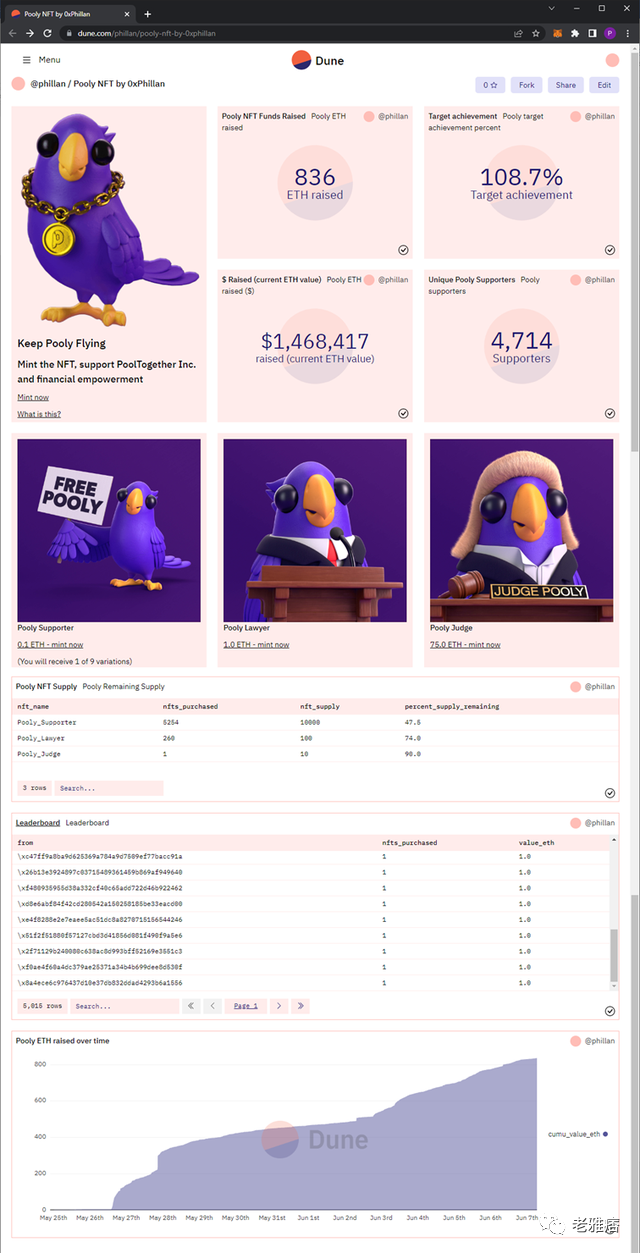
First, let's decide which charts we want to use on our dashboard. Let's rebuild the view Pooly built on its home page! Taking a closer look at the two screenshots below, we can see some metrics based on on-chain data.
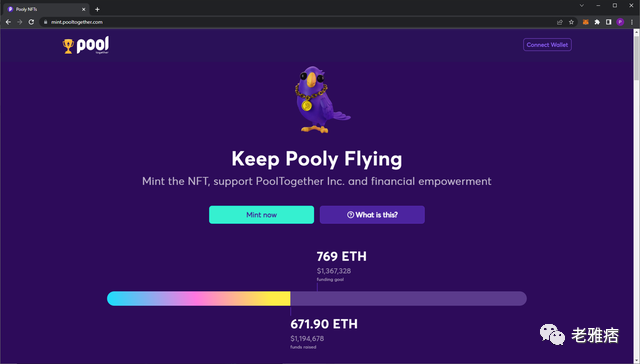
Pooly NFT landing page with funds tracker
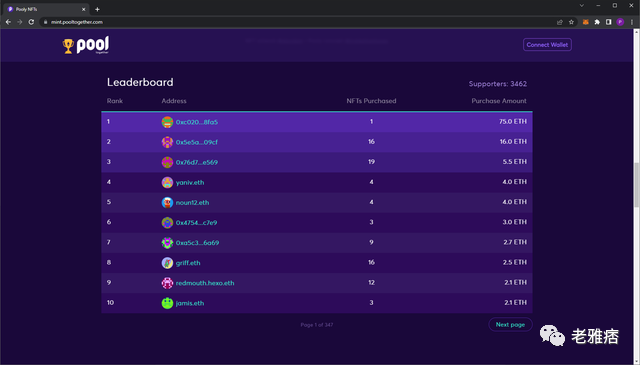
Pooly NFT Leaderboard
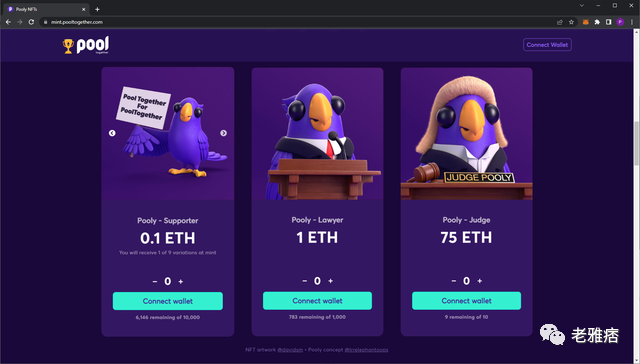
image description
Pooly NFT Mint Options and Supply
We can see that:
Funds Raised vs Funding Target in ETH
Funds Raised vs. Funding Goals in USD
Total number of backers (unique addresses where Pooly was purchased)
Leaderboard includes addresses, number of NFTs purchased by each address, and total ETH in descending order
Maximum supply and remaining supply of each of the three NFT types
Isn't it super awesome! But these are just snapshots in time. Let's also give ourselves another challenge:
Make a time series graph of ETH rising over time
As it stands, we can't build views in the same way as the Pooly website, but we can capture the same amount of data (and even more!) to build our dashboards.
looking for the right information
Before we can start using Dune, we need to find the right information. From the website, we can see that PoolTogether is selling three sets of NFTs:
Backer – 1 of 9 random collectibles worth 0.1 ETH
Lawyer – 1 ETH for just one piece of art
Judges - 75 ETH for only one artwork
Let's head over to Etherscan and see if we can find a Pooly-related smart contract. After opening Etherscan.io, type "Pooly" to see if the owner of these smart contracts has registered them on Etherscan.
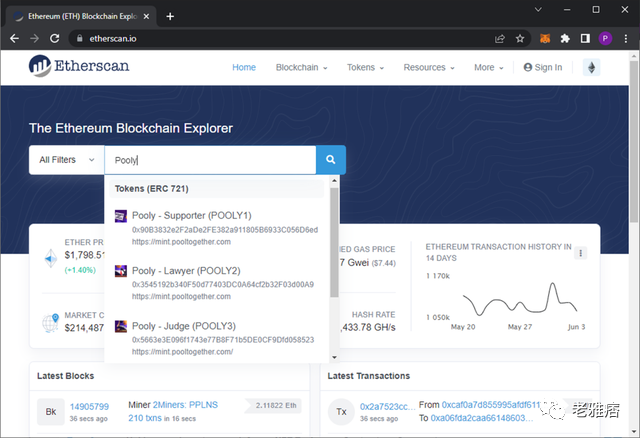
image description
Search Pooly on Etherscan
Open each of the three collections and copy the smart contract address by clicking the copy icon that appears when you hover over that address. At the bottom of the page we can also see all recent transactions, which will help with troubleshooting later on.
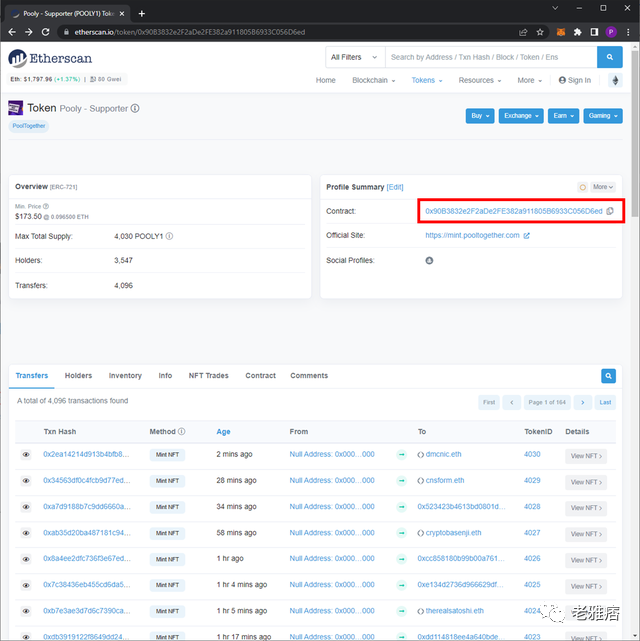
image description
Find the Pooly contract address through Etherscan
We will need these contract addresses to pull the correct data from Dune, and they form the basis of all our queries:
0x90B3832e2F2aDe2FE382a911805B6933C056D6ed
1.0 ETH Pooly Lawyer:
0x3545192b340F50d77403DC0A64cf2b32F03d00A9
0.1 ETH Pooly supporters:
0x5663e3E096f1743e77B8F71b5DE0CF9Dfd058523
75 ETH Pooly Judge:
First, navigate to dune.com and click on "New Query" in the upper right corner of the screen.
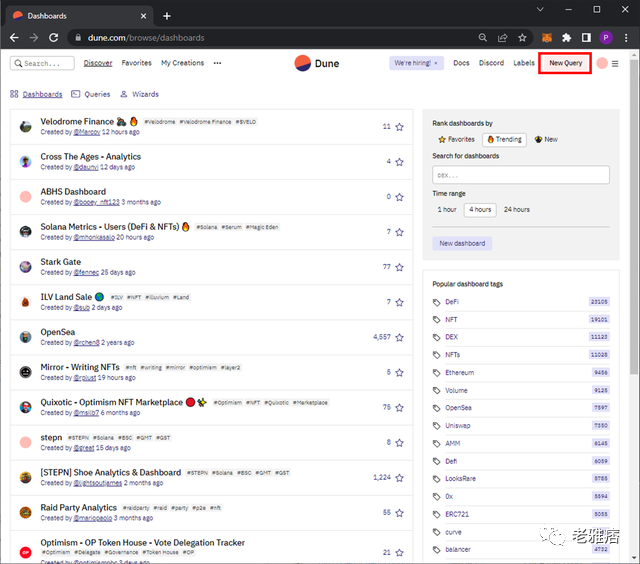
image description
This will open the query editor and we can start working on our queries!
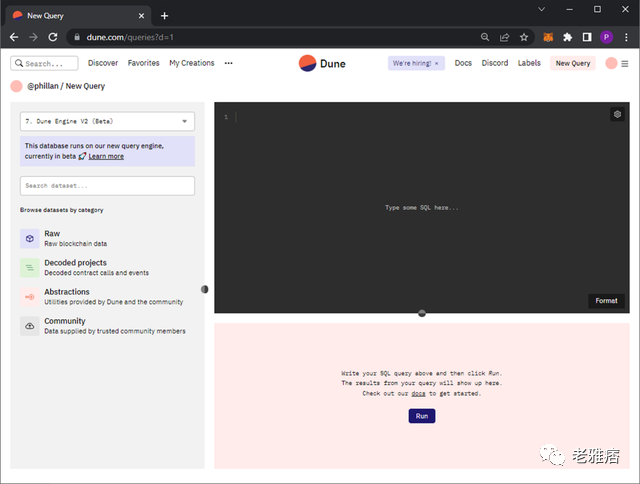
image description
new and untouched new query windows
Query 1: Funds raised in ETH
First, change from "7. Dune Engine V2 (Beta)" to "1. Ethereum" in the upper left corner. Pooly is on Ethereum, so we only need Ethereum data for this query. In addition, "1. Ethereum" is more mature than Dune Engine V2, which has just entered the beta stage.
select SUM("value"/1e18) from ethereum.transactions
where "to" = '\x90B3832e2F2aDe2FE382a911805B6933C056D6ed'
or "to" = '\x3545192b340F50d77403DC0A64cf2b32F03d00A9'
or "to" = '\x5663e3E096f1743e77B8F71b5DE0CF9Dfd058523'
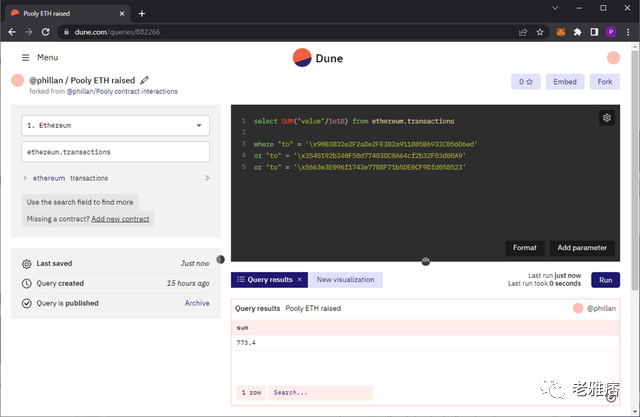
For our first query, we'll build a counter showing the funds raised denominated in ETH. To do this, copy the following code into Dune's query field and press Run (or CTRL+Enter):
The code above is an SQL query that parses Dune's database for the specific data we requested. You can think of Dune's database as a collection of various tables, each containing specific information you might want to extract. Using SQL, you can achieve:
Specify the data you want (which column in the table)
Do you want to convert the data
Which table do you want to fetch data from
Whether to filter data
select * from ethereum.transactions
where "to" = '\x3545192b340F50d77403DC0A64cf2b32F03d00A9'
You'll get a big table with a lot of information:
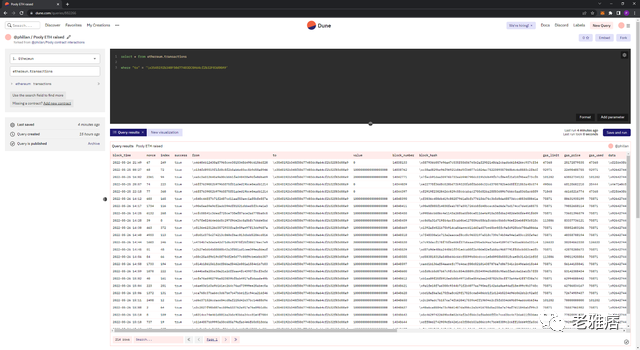
image description
Now let's look at the SQL code:
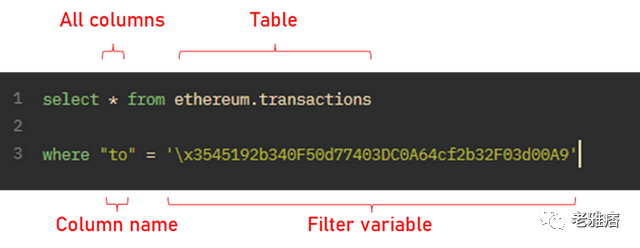
image description
SQL code decomposition
This code means "select all columns from the transaction table in the ether category, where the value of the to column is
You can view the columns in a table without running a query. Data Browser lets you explore various headers through its nifty search function:
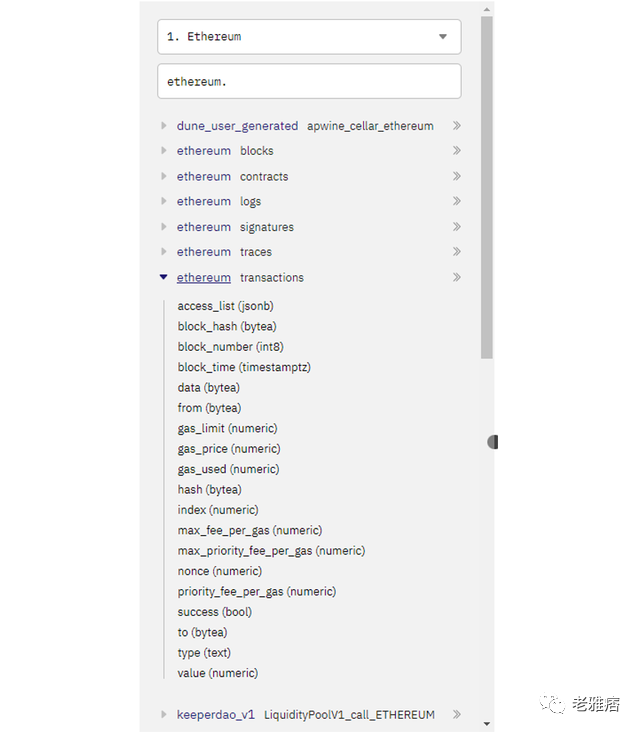
image description
Search tables in "Ethereum" using Data Browser
We could remove row 3 entirely to remove the filter, however, this would return a huge table and the query would take a long time to complete. The more precise your queries, the faster they will run!
select "value" from ethereum.transactions
where "to" = '\x3545192b340F50d77403DC0A64cf2b32F03d00A9'
Now we have only one "value" column instead of many as we saw before:
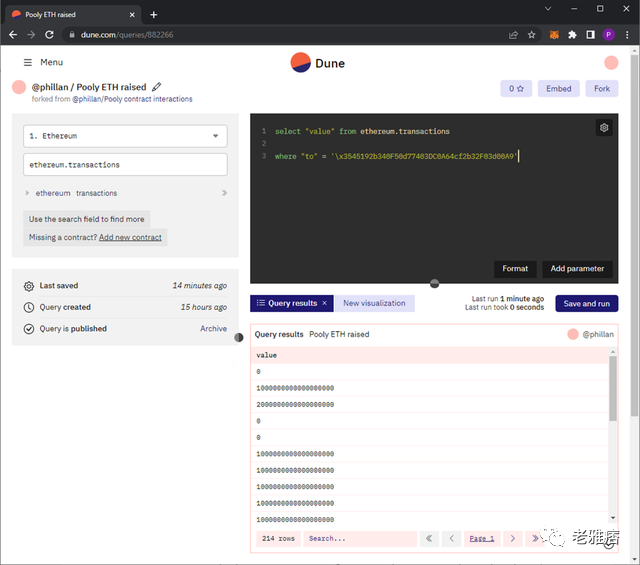
image description
Returns all entries in the "value" column
select "value"/1e18 from ethereum.transactions
where "to" = '\x3545192b340F50d77403DC0A64cf2b32F03d00A9'
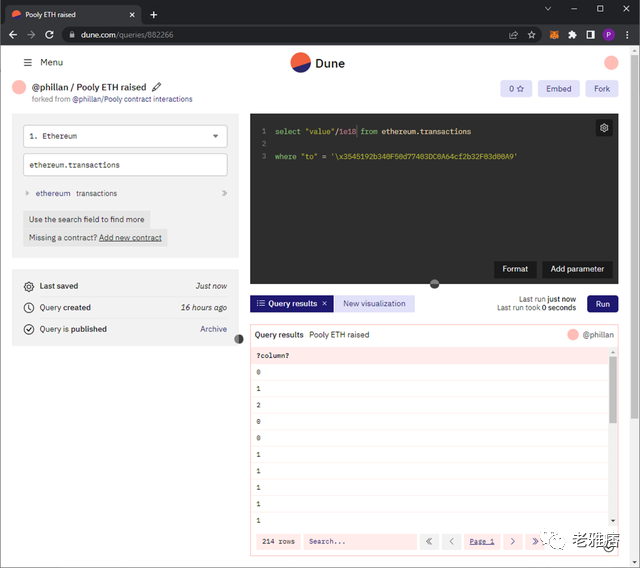
However, you may notice that these values seem to be very large. That's because they are denominated in Wei and not ETH! To fix this, we can simply apply arithmetic operators to the "value" column:
Doesn't it look so much better! 1e18 in SQL is the same as 10^18, we just tell Dune to divide this number by 1,000,000,000,000,000,000 so that we see the value in ETH instead of Wei.
select SUM("value"/1e18) from ethereum.transactions
where "to" = '\x3545192b340F50d77403DC0A64cf2b32F03d00A9'
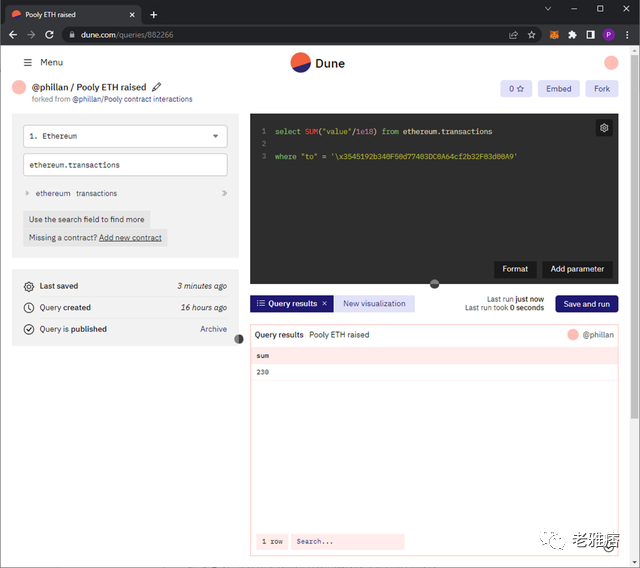
Great, we can now see the total amount of ETH spent on Pooly2! Since we want to get the total spend of all three Pooly NFT smart contracts, we need to add two more lines to include details about the other smart contracts:
select SUM("value"/1e18) from ethereum.transactions
where "to" = '\x90B3832e2F2aDe2FE382a911805B6933C056D6ed'
or "to" = '\x3545192b340F50d77403DC0A64cf2b32F03d00A9'
or "to" = '\x5663e3E096f1743e77B8F71b5DE0CF9Dfd058523'
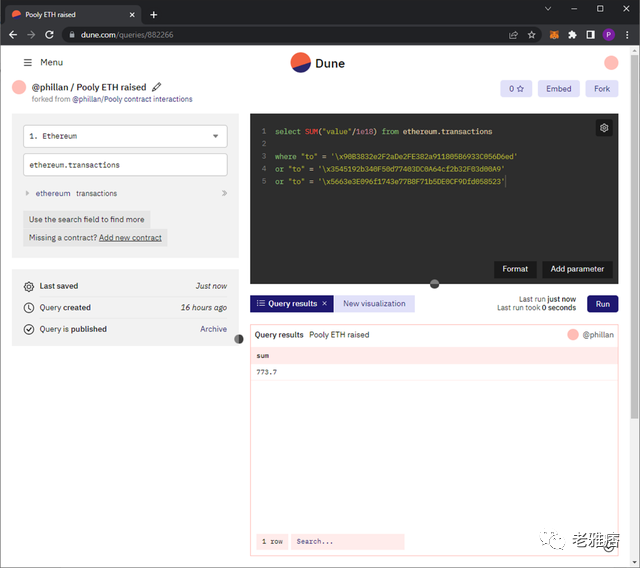
image description
final output
The "or" command works in conjunction with the "where" command and specifies that when filtering values in the "to" column, if the first or second or third value is found, the row should be considered.
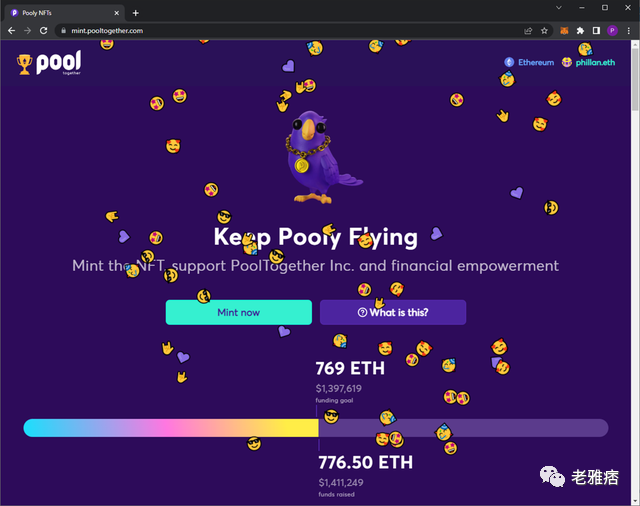
We now see that a total of 773.7 ETH was spent for all three Pooly contracts. Astonishing! Let's go to the Pooly website to see if it's correct:
Compare our output with the official data on the Pooly NFT page. Funding Goal Reached - Congratulations!
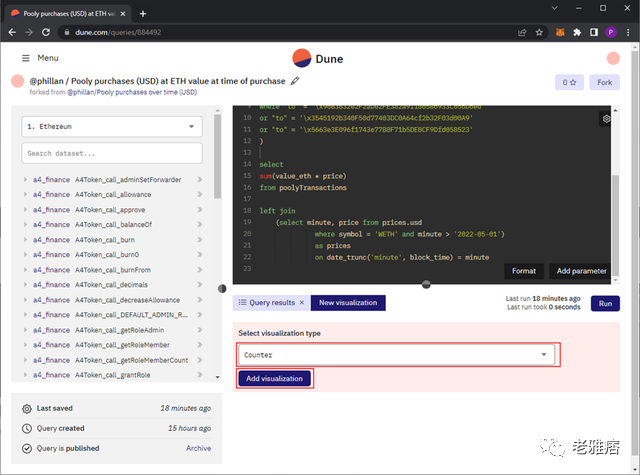
Now that our query is complete, we need to set up a counter to display it on our dashboard later. Below the query results box, click the new visualization, and then click Counters in the drop-down menu that appears.
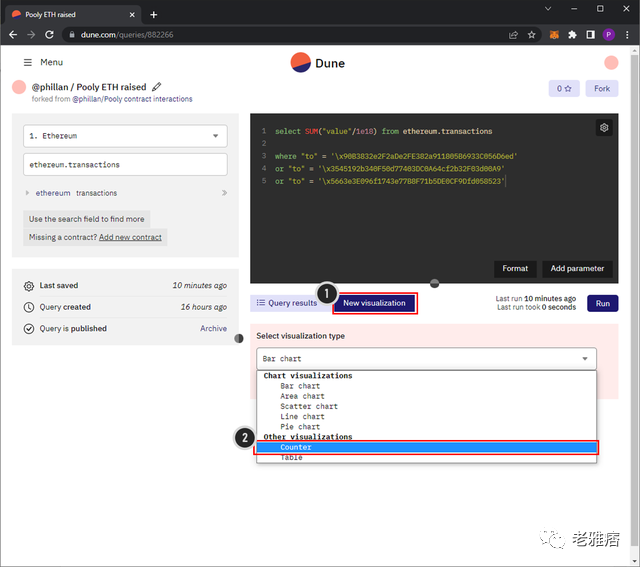
image description
Finally, click Add Visualization:
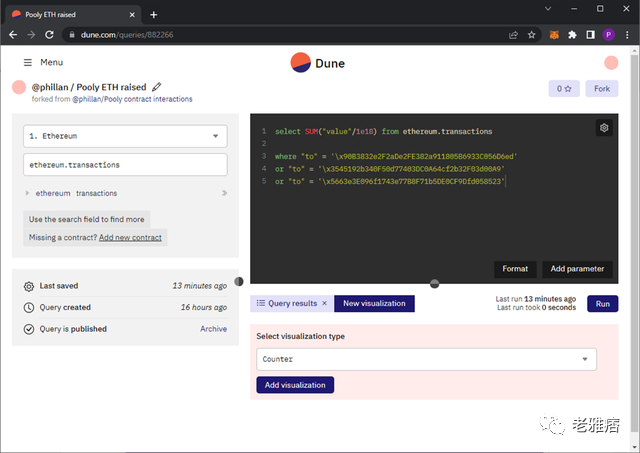
image description
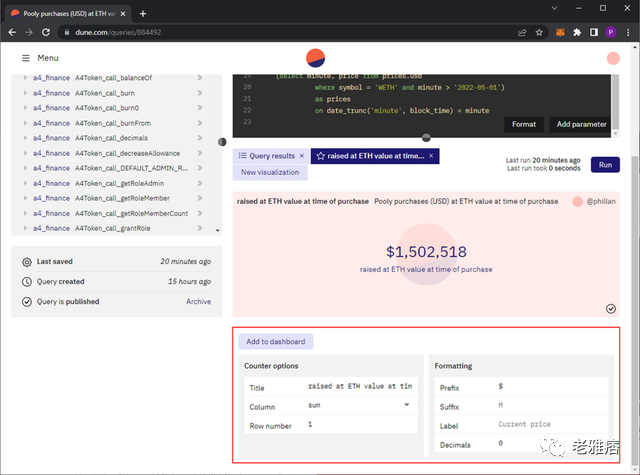
A counter will appear, and if you scroll down, you'll see various settings. Just adjust the settings to your liking.
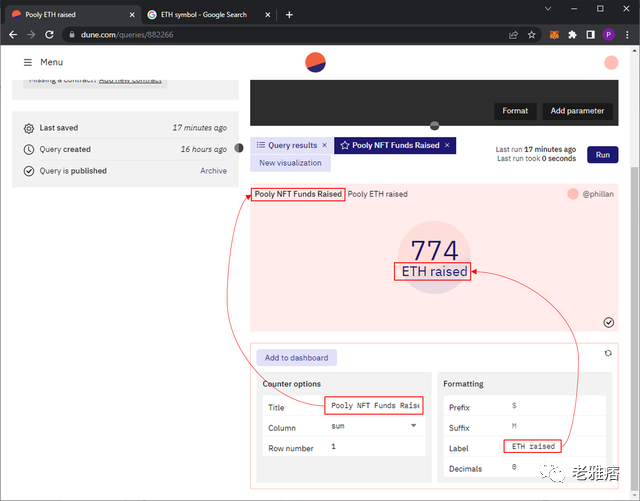
image description
Once done, click (1) Add to Dashboard and select (2) New Dashboard. Then (3) name your dashboard and (4) click Save Dashboard. The new dashboard will appear in your list of dashboards. From here click (5) Add on the dashboard you wish to add the visualization to. Once added, the label will change from "added" to "added".
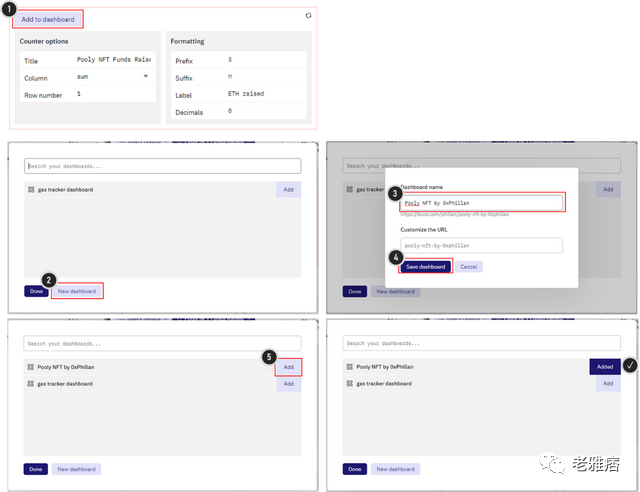
image description
If you click on the name of the dashboard ("Pooly NFT by 0xPhillan") in this submenu, you will be taken to the dashboard showing our trackers.
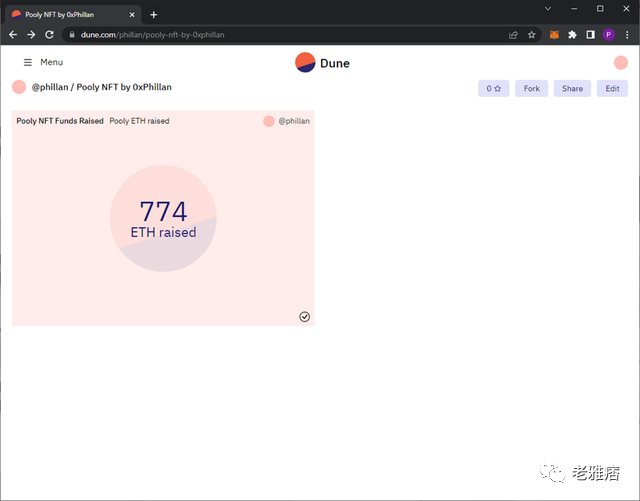
image description
Added visual dashboard
Well done!
Once we've got all our queries set up, we'll get back to editing our dashboard.
Query 2: Funds raised in USD
We have two ways to solve this problem:
Use the current value of USD funds used to purchase NFTs
If we look at the smart contract on Etherscan, we can see that most of the 776.5 ETH has been moved out of the smart contract, with 299.2 ETH left in the Poly NFT smart contract as of this writing.
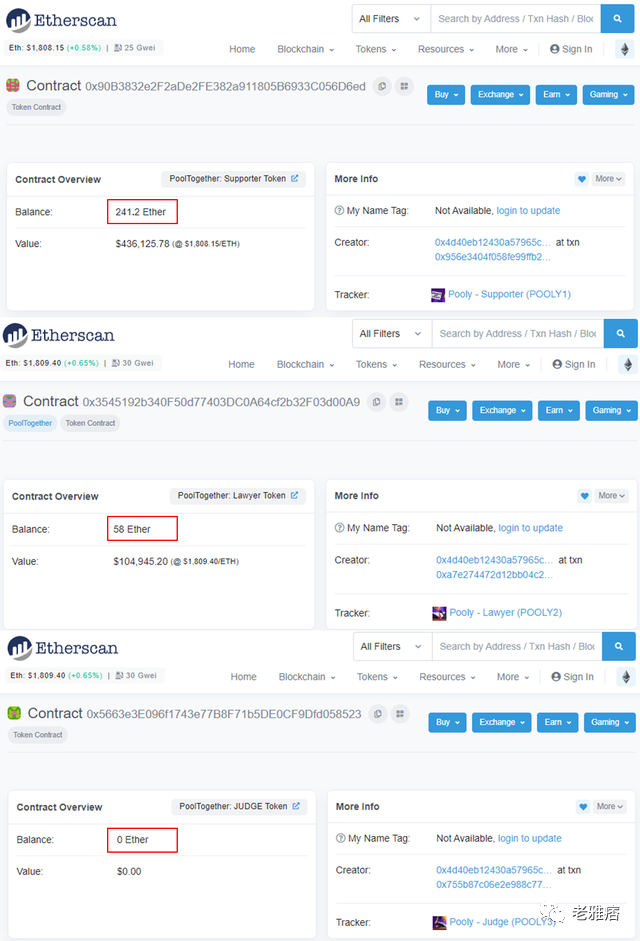
image description
Pooly1/2/3 smart contract ETH balance on Etherscan.io
If we look at the previous Pooly website screenshot, 776.5 ETH is worth $1,411,249 ($1,817/ETH), implying that the Pooly smart contract owner may be keeping funds in ETH, rather than USD.
Ultimately, it's hard to say which approach Pooly takes, but both ways of calculating dollar value are interesting:
Current value tells us what the funds are worth now
The value at the time of purchase tells us the buyer's expected dollar amount
So... let's create together!
Query 2a: Funds raised in USD at current ETH value
First, fork the query we just created:
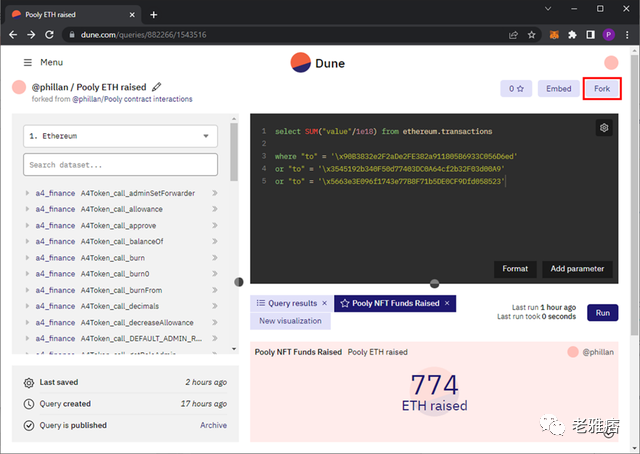
image description
Fork the previous query
select SUM("value"/1e18) * (
SELECT "price" FROM prices.usd
WHERE "symbol" = 'WETH'
AND "minute" < now() - interval '1 hours'
ORDER BY "minute" DESC
LIMIT 1
)
from ethereum.transactions
where "to" = '\x90B3832e2F2aDe2FE382a911805B6933C056D6ed'
or "to" = '\x3545192b340F50d77403DC0A64cf2b32F03d00A9'
or "to" = '\x5663e3E096f1743e77B8F71b5DE0CF9Dfd058523'
Then adjust your code to look like this:
You'll notice that we added a multiplication operator * and a large code block after the SUM("value"/1e18) command.
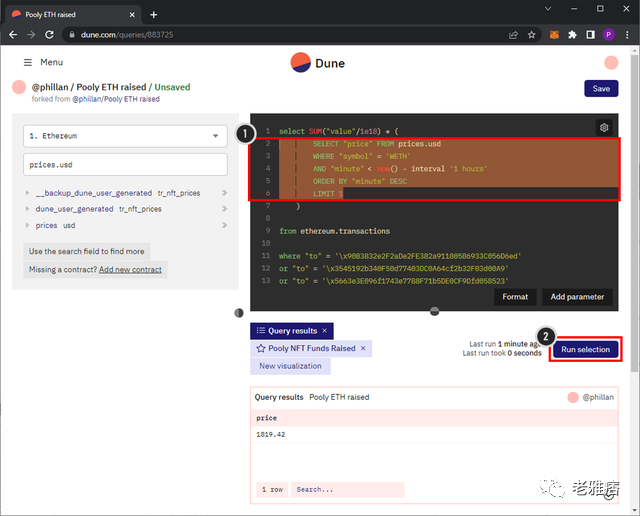
In Dune, you can highlight specific parts of your query and run only that part by clicking Run Selection. Let's (1) highlight only the lines inside the brackets and (2) run the selection:
By selecting part of the query, you can run only the selected part.
Let's break down this code block:
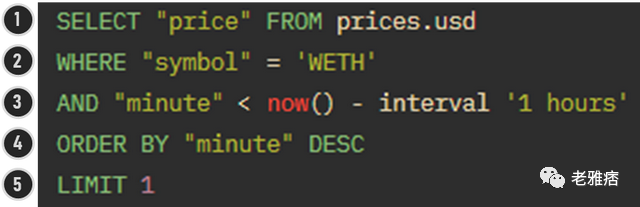
image description
Breakdown of the previous code
Select the "Price" column from the price.usd table
Filter the symbol column for "WETH"
Only look at time entries for the past 1 hour (this will speed up queries significantly)
Sort in descending order (newest first)
To better understand this code, let's make some small adjustments to the query. (1) replace "price" with * (returns all columns) and (2) select only rows 2 to 5 of the code, then (3) run the select:
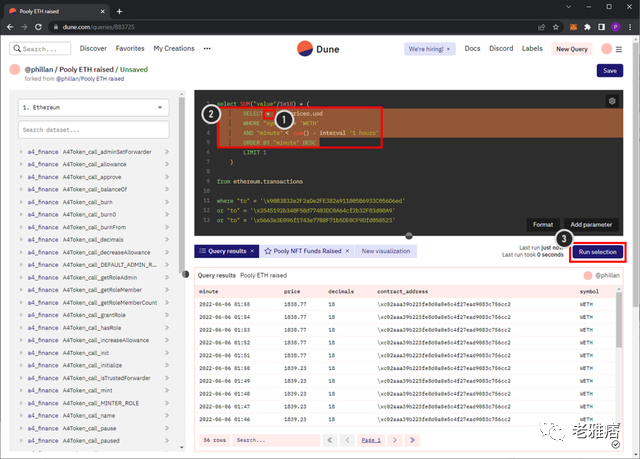
image description
In the query results, you will see the complete table with five columns. First, let's check the contract address in Etherscan.io:
0xC02aaA39b223FE8D0A0e5C4F27eAD9083C756Cc2
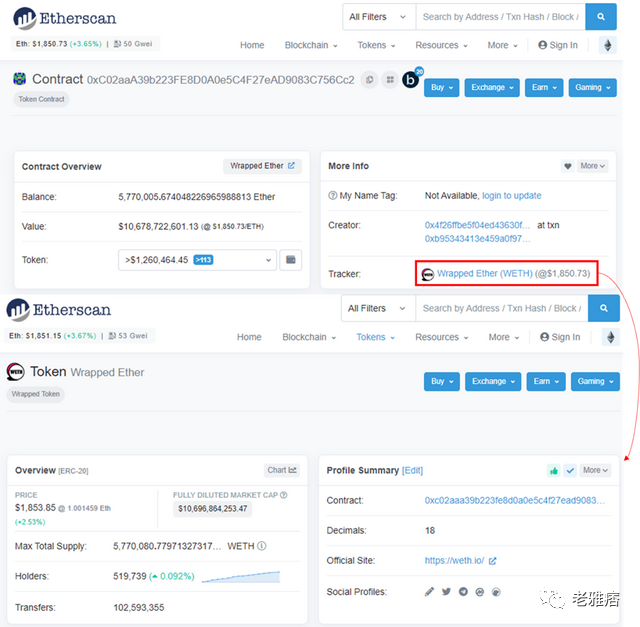
image description
WETH Smart Contract on Etherscan.io
Let's turn our attention back to the previous table:
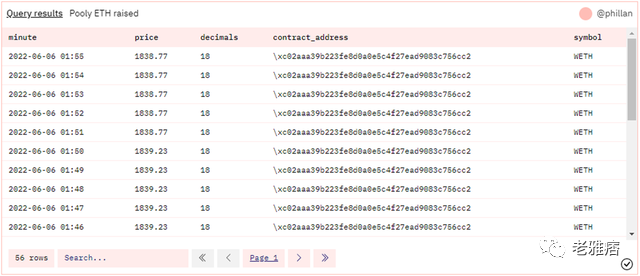
image description
query result table our previous query
Here we have a column called "minute minute" which tracks the value of ETH to USD every minute. Since we limit our queries to "1 hour intervals", we only get the most recent hour of data available. For our purposes, we really only need the most recent data entry, so limiting this query to the last hour will speed it up significantly. For example, it can also be changed to "1 day", "3 days" or "1 week" to get more historical data.
Let's revert our code to what we changed at the beginning of this section and run the query:
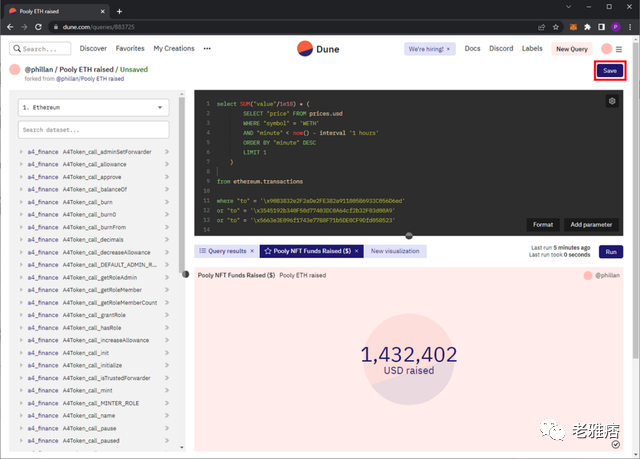
image description
save query
For this, we'll use counters again, so scroll down and (1) click on the counter that was forked from our previous query, (2) adjust the data source and (3) change the labels.
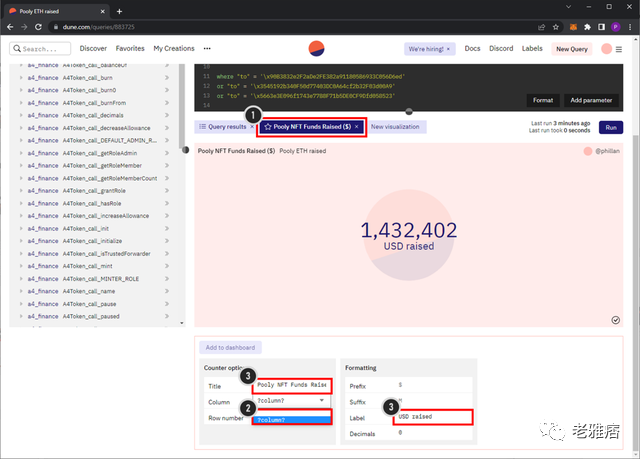
image description
When you're done, remember to save and add to our dashboard:
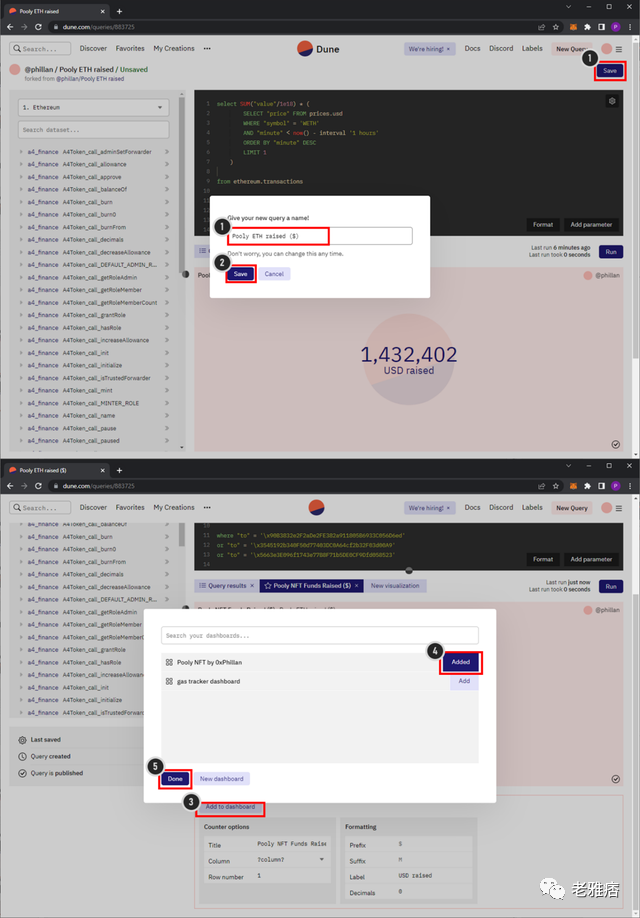
image description
Once added, it will look like the image below. Don't worry, we'll clean it up at the end of this guide. Now, don't worry about the looks!
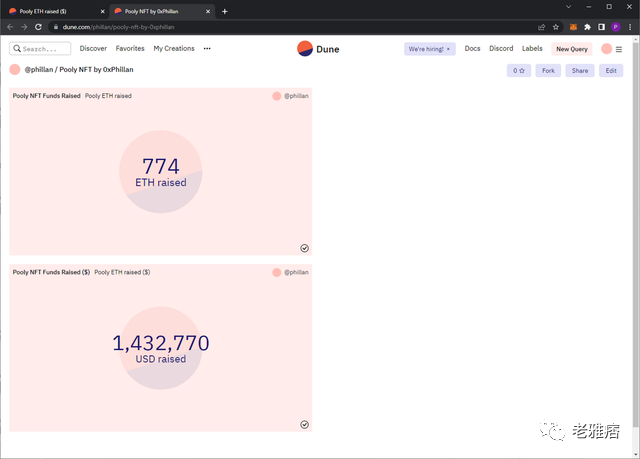
image description
Dashboard with second query added
Query 2b: Funds raised in USD, ETH value at time of purchase
Again, let's fork the previous query to prepare for our next query:
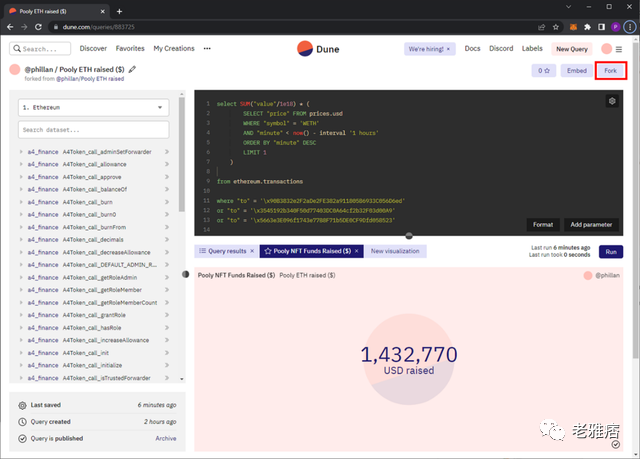
image description
From the forked code, we do the following:
with poolyTransactions as
(
select
block_time,
value/1e18 as value_eth
from ethereum.transactions
where "to" = '\x90B3832e2F2aDe2FE382a911805B6933C056D6ed'
or "to" = '\x3545192b340F50d77403DC0A64cf2b32F03d00A9'
or "to" = '\x5663e3E096f1743e77B8F71b5DE0CF9Dfd058523'
)
select
sum(value_eth * price)
from poolyTransactions tx
left join
(select minute, price from prices.usd
where symbol = 'WETH' and minute > '2022-05-01')
as prices on date_trunc('minute', block_time) = minute
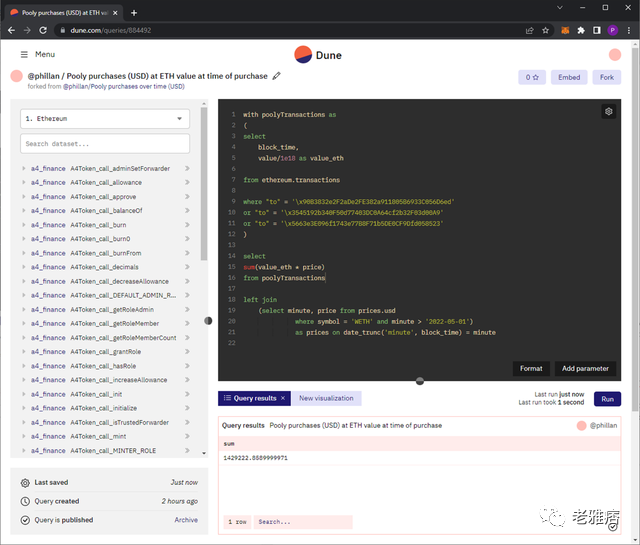
image description
Use the ETH-USD exchange rate query when purchasing NFT
Let's break this code into three parts:
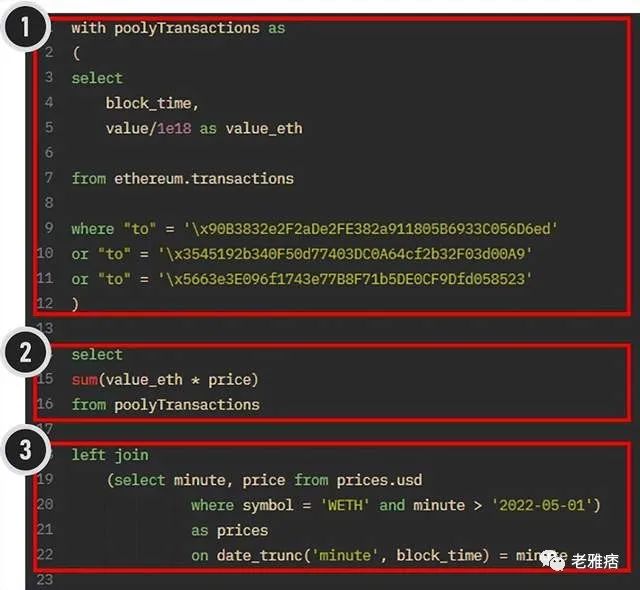
image description
Divide the query into three parts
Section 1
Here we build the first table we will reference. What we've done here is create an auxiliary table we call "poolyTransactions" which will hold the block_time and value_eth from the ethereum.transactions table (the value in wei is divided by 10^18 to convert to ETH, we give it a custom name). For this table, we filter the three Pooly addresses we know.
Here it is explained line by line:
Line 1: Use poolyTransaction as - Defines a secondary table named "poolyTransaction" with the following attributes
Lines 3-11: Select the columns and filters to include in the ethereum.transcations table
Line 5: value/1e18 as value_eth - here we rename the column to "value_eth" so that we can refer to it directly in section 2 instead of doing other calculations
chapter 2
This is where we create the output table. You'll notice that we're building a table from poolyTransactions, the auxiliary table we created in Section 1, but we're also referencing a column called "price" that we haven't defined yet. The price is actually only defined after line 19! This is possible because we joined poolyTransactions in Section 3 with some output from the price.usd table. So essentially we're creating the next section of a table using our auxiliary table poolyTransactions and the table we built out of price.usd.
Section 3
This is where we define a table to be joined with another table. The "left join" keyword allows us to do this:
Line 18: left join - Keyword used to indicate that we want to join our first table (left table) with another table (right table). This means that the first table we defined in Section 1 acts as the base table.
Lines 19-20: Here we define the table we want to create from price.usd. In line 20, we limit the duration to "2022-05-01" because the Pooly smart contract is only deployed in May, so if we limit it to a smaller time frame, querying the data can be significantly sped up the process of.
Line 22: on data_trunc('minute', block_time) = minute – This is the line that joins our auxiliary table (section 1) with the price table (section 3 lines 19-20). What it's talking about here is taking the column "block_time" from our secondary table and truncating it to minutes only, i.e. dropping all other data that is not minutes (e.g. seconds, milliseconds, etc.). The price.usd table is already truncated to minutes, so no further conversion is needed here. The minute column in prices.usd is then matched with the minute column in our auxiliary table, thus assigning the correct price from prices.usd to the corresponding minute timestamp in poolyTransactions.
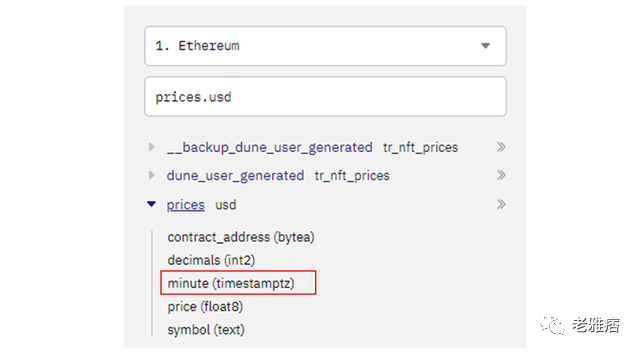
image description
To better visualize the third section, I reorganized the sections to make them easier to understand:
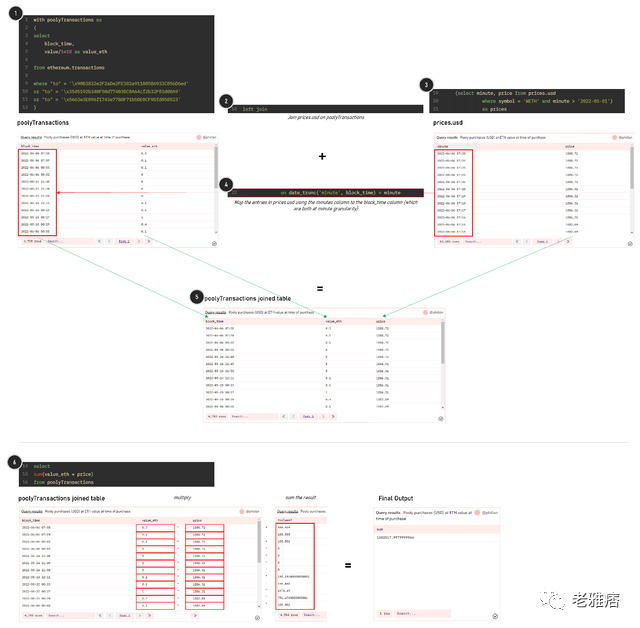
image description
Visualization of each step of the connection command
(1) We create the poolyTransactions table, then (2) we tell SQL to join it with another table, and (3) we define it as the minutes and price columns from the prices.usd table. Then (4) join this price.usd table we created to the left table poolyTransactions, using the time in minutes as the mapping variable. To join the tables, both tables must have the exact same entries, if we truncate the block_time variable to minutes, we create matching minutes between the two tables. By doing this, (5) the poolyTransactions table is updated to include a price column with the price value matching the corresponding date.
Now add a counter, save and add to dashboard!
Add a counter visualization to a query
Counter visualization setup and added to dashboard
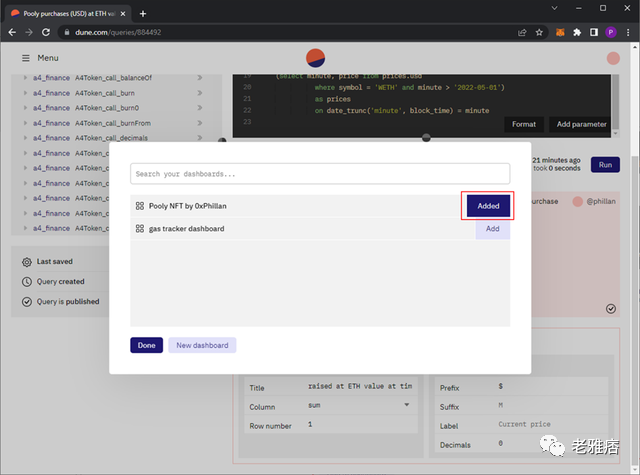
image description
Counter visualization added to dashboard
Query 3: Total number of supporters
To do this, let's first open our first query, fork it, and remember, save this step too.
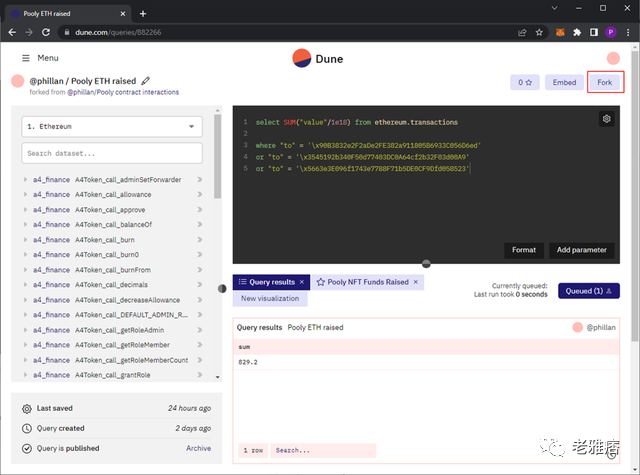
image description
Here we simply change the first line:
select COUNT(DISTINCT "from") from ethereum.transactions
where "to" = '\x90B3832e2F2aDe2FE382a911805B6933C056D6ed'
or "to" = '\x3545192b340F50d77403DC0A64cf2b32F03d00A9'
or "to" = '\x5663e3E096f1743e77B8F71b5DE0CF9Dfd058523'
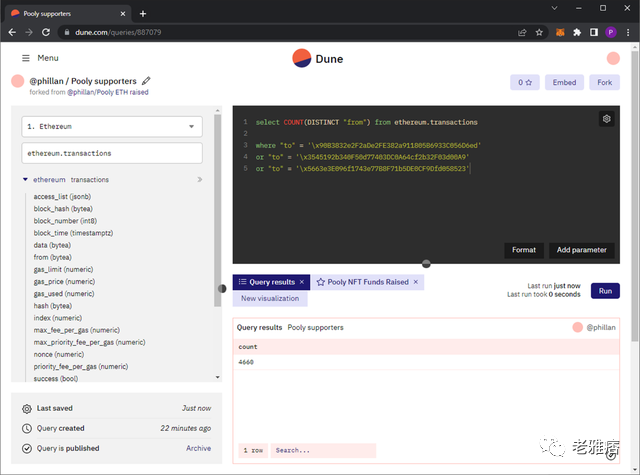
image description
The COUNT variable counts all transactions, while the DISTINCT keyword ensures that each unique entry is counted only once. The result we got was 4660 unique backers. If we compare this to the unique supporters on the Pooly website, we see that they are pretty close:
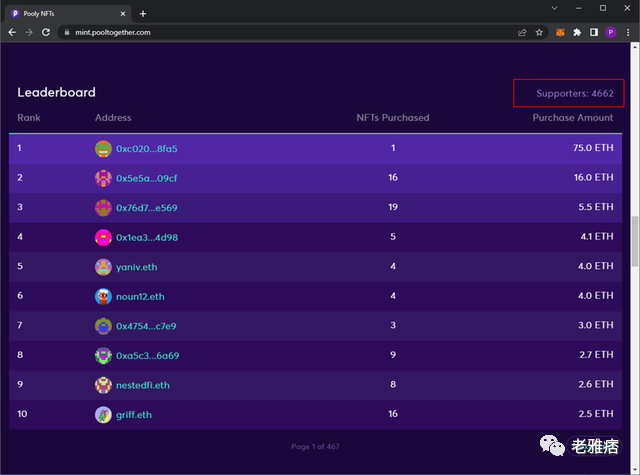
image description
Pooly Live Supporter Data
Finally, change the visualization counter and add it to the dashboard again.
Adjust the visualization settings of the counter and add to the dashboard
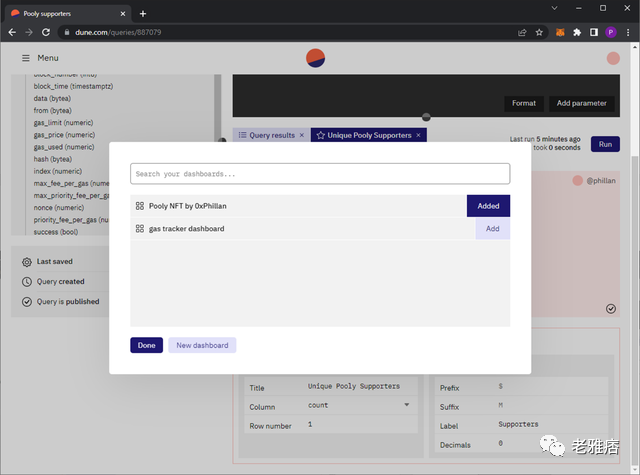
image description
Counter added to dashboard
Query 4a: leaderboard using erc721, summary
Next, let's build a leaderboard consisting of addresses, number of NFTs purchased by each address, and total ETH in descending order.
To view the leaderboard, we need three pieces of information. First is the address of the purchaser, then the amount of NFTs purchased, and finally the amount of ETH spent to purchase all NFTs.
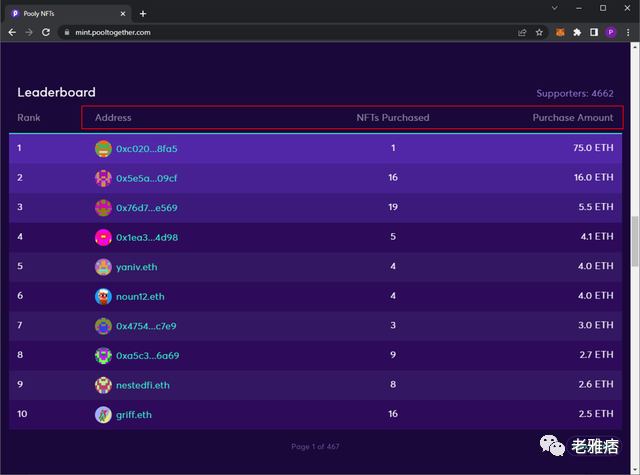
image description
Pooly leaderboard column
We do this with the following query:
with poolyTransactions as
(
select
"from",
hash,
value/1e18 as value_eth
from ethereum.transactions
where "to" = '\x90B3832e2F2aDe2FE382a911805B6933C056D6ed'
or "to" = '\x3545192b340F50d77403DC0A64cf2b32F03d00A9'
or "to" = '\x5663e3E096f1743e77B8F71b5DE0CF9Dfd058523'
)
select
"from", nfts_purchased, value_eth
from poolyTransactions
left join
(Select evt_tx_hash, COUNT("tokenId") as nfts_purchased
From erc721."ERC721_evt_Transfer"
Where (contract_address = '\x90B3832e2F2aDe2FE382a911805B6933C056D6ed'
or contract_address = '\x3545192b340F50d77403DC0A64cf2b32F03d00A9'
or contract_address = '\x5663e3E096f1743e77B8F71b5DE0CF9Dfd058523')
and "from" = '\x0000000000000000000000000000000000000000'
group by 1)
as nfts
on evt_tx_hash = hash
ORDER BY 3 desc
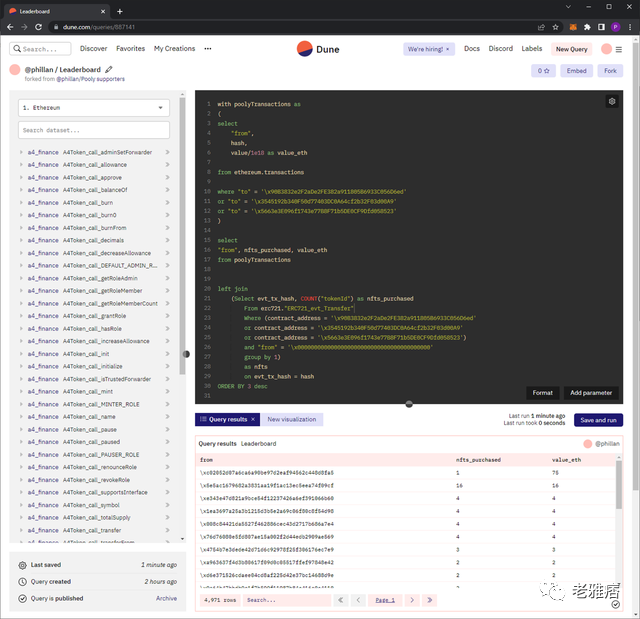
image description
Pooly leaderboard table
You'll notice that this is very similar to the query in "Funded in USD with ETH value at purchase", this is because we use the same approach: we first collect transaction data in the poolyTransactions table, then we leave the first Two tables - it has a common mapping value on it.
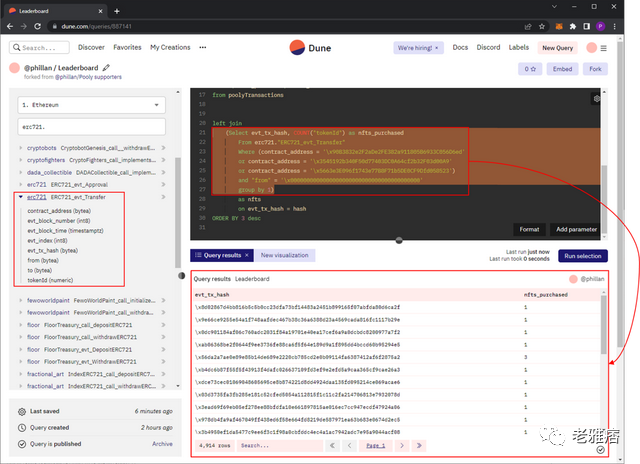
Here, for the second table, we use erc721. The "ERC721_evt_Transfer" table is a digest maintained by Dune that tracks all NFT transfers on Ethereum. If we use the dataset browser, enter "erc721". and scroll to "ERC721_evt_Transfer" we can see everything contained in that particular table. We can also just highlight the command for the second table and see what the output is:
You'll also notice that the way filters are defined is a bit special. The first three filters are now enclosed in parentheses, while the last filter is outside the parentheses.
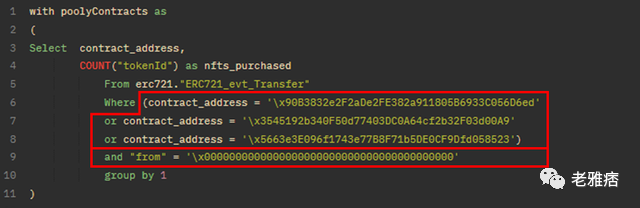
image description
Parentheses determine the order of calculation and/or filter commands, just like when performing arithmetic commands in SQL. If we didn't enclose the first three statements, the and condition would only apply to the last filter setting.
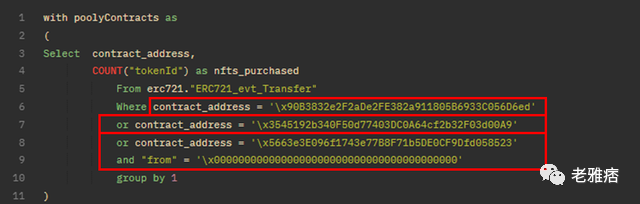
image description
Evaluation without parentheses
Since we want to apply the from null address filter to all results from the previous filter, we need to add the parentheses.
Finally, since we are using the "COUNT" command, we need to specify in which column to count (i.e., which variable to aggregate the count into). To do this, we use the "group by" command to indicate that we want to group the count of "tokenId" into the first column in the table, which is "evt_tx_hash"."ERC721_evt_Transfer "As mentioned earlier, we need a common mapping value to map the second table to table. Here we use the transaction hash to map the amount of NFT purchased per transaction to our poolyTransactions table, this time we also ask for the transaction hash. So in the end, we will erc721."nfts"table (which we named
) is mapped to our poolyTransactions table, which only includes transactions for buying poolys.
Finally, we tell Dune to "ORDER BY 3 desc", which means that the third column of our output table should be in descending order:
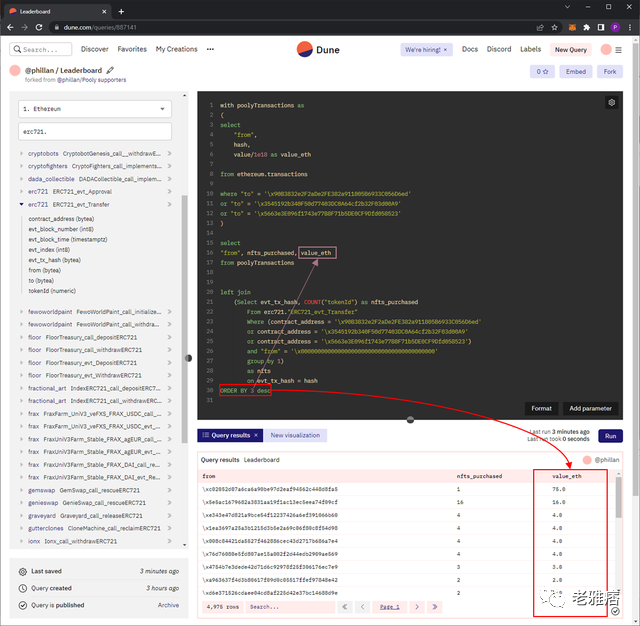
image description
Awesome! Our leaderboard is complete. Let's compare this to the leaderboard on the Pooly NFT website:
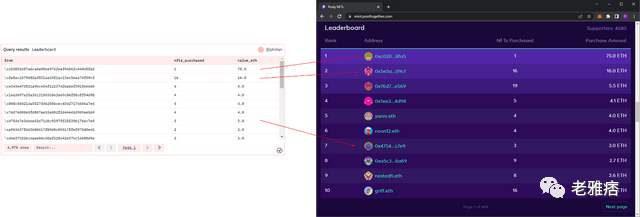
image description
Compare the Dune query leaderboard with the Pooly website leaderboard
Not all numbers are the same, but we can see from this list that some addresses, NFTs purchased, and total ETH spent do have the same numbers. This is again a sync timing issue between Dune and real-time blockchain data, nothing to worry about.
Remember to save your query and add it to the dashboard.
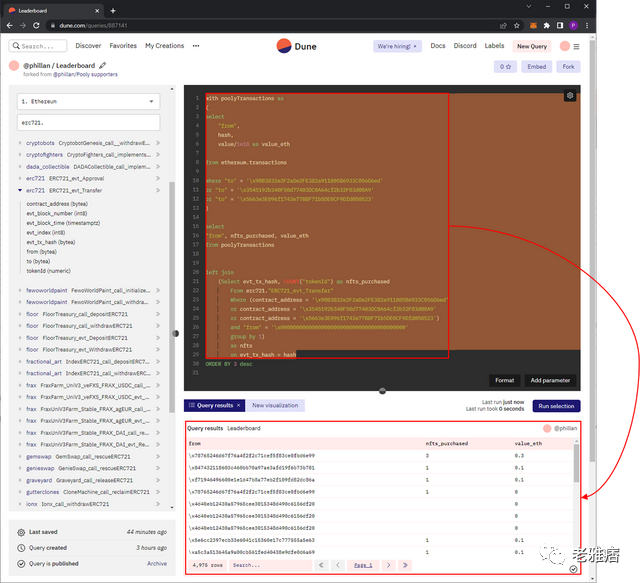
Query 4b: Leaderboard decoding table using poolysupporter
with poolyTransactions as
(
select
"from",
hash,
value/1e18 as value_eth
from ethereum.transactions
where "to" = '\x90B3832e2F2aDe2FE382a911805B6933C056D6ed'
or "to" = '\x3545192b340F50d77403DC0A64cf2b32F03d00A9'
or "to" = '\x5663e3E096f1743e77B8F71b5DE0CF9Dfd058523'
)
select
"from", nfts_purchased, value_eth
from poolyTransactions
left join
(Select call_tx_hash, "_numberOfTokens" as nfts_purchased
From poolysupporters."PoolyNFT_call_mintNFT"
where contract_address = '\x90B3832e2F2aDe2FE382a911805B6933C056D6ed'
or contract_address = '\x3545192b340F50d77403DC0A64cf2b32F03d00A9'
or contract_address = '\x5663e3E096f1743e77B8F71b5DE0CF9Dfd058523'
)
as nfts
on call_tx_hash = hash
ORDER BY 3 desc
The method is the same as above, except that using this table we can directly return all transaction hashes that call the mintNFT function, instead of using an empty address to determine transactions from erc721. The "ERC721_evt_Transfer" table is a mint transaction.
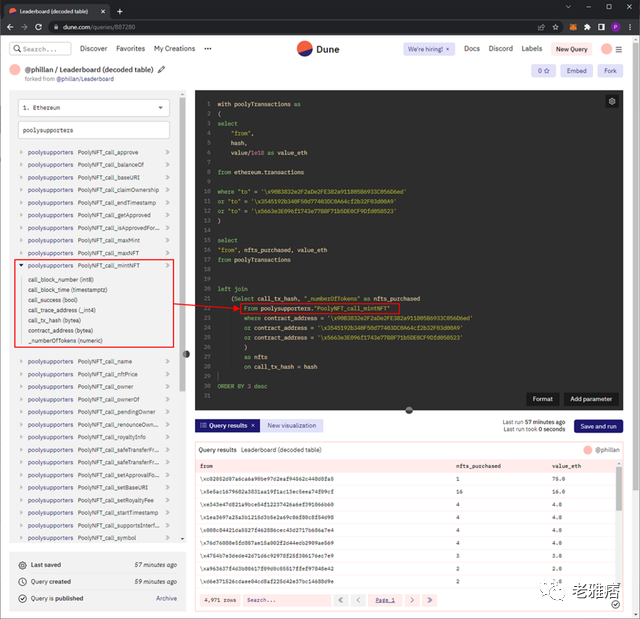
image description
Use pool supporters. instead of erc721
The poolysupporter dataset allows us to make more specific and detailed queries as we can refer to specific contract calls.
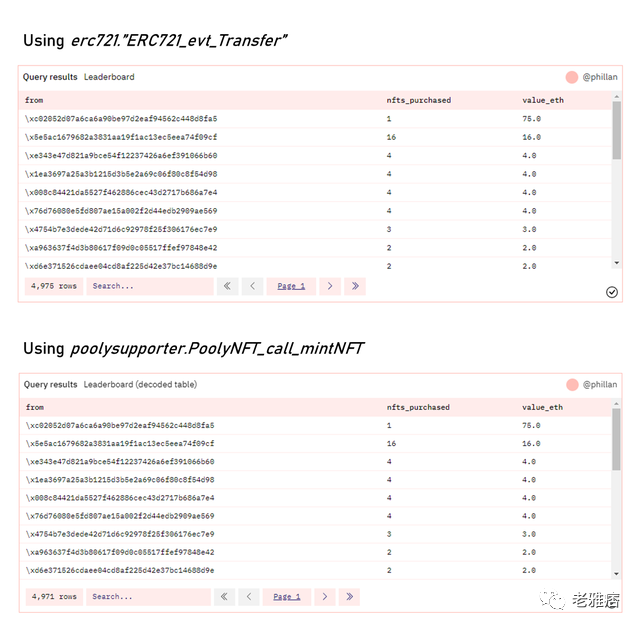
Let's compare the results of the two tables to make sure there is nothing wrong:
You see, the output is the same.
Remember to save your query and add it to the dashboard.
In an alternate version of query 4, we use the poolysupporter function. You may have seen that when you search for pooly in the dataset explorer, you also see a function called "PoolyNFT_call_maxNFT".
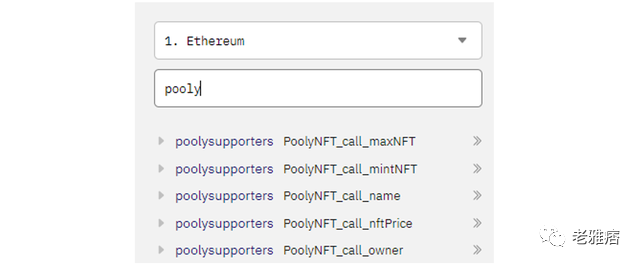
image description
You can conclude that you can use this function call to directly retrieve the max minted NFT.
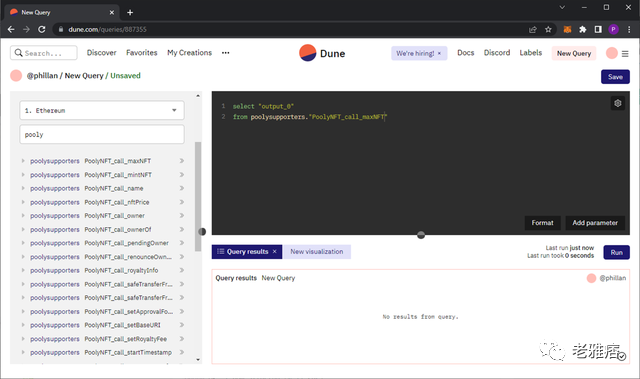
image description
Unfortunately, this is not possible: this function is a "read" function, so there is no on-chain record of when this function was called. See Etherscan below:
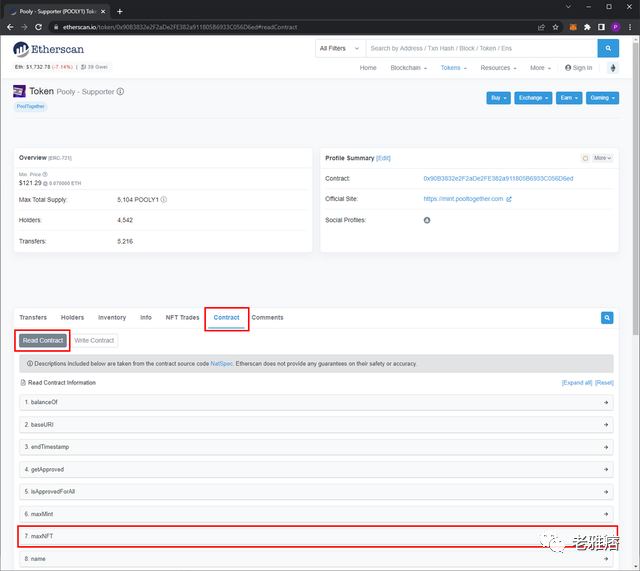
image description
maxNFT is a read function, it does not leave any records on the blockchain
Instead, we have to manually enter the maxNFT data for each smart contract:
with poolyContracts as
(
Select contract_address,
COUNT("tokenId") as nfts_purchased
From erc721."ERC721_evt_Transfer"
Where (contract_address = '\x90B3832e2F2aDe2FE382a911805B6933C056D6ed'
or contract_address = '\x3545192b340F50d77403DC0A64cf2b32F03d00A9'
or contract_address = '\x5663e3E096f1743e77B8F71b5DE0CF9Dfd058523')
and "from" = '\x0000000000000000000000000000000000000000'
group by 1
)
select
CASE contract_address
WHEN '\x90B3832e2F2aDe2FE382a911805B6933C056D6ed' then 'Pooly_Supporter'
WHEN '\x3545192b340F50d77403DC0A64cf2b32F03d00A9' then 'Pooly_Lawyer'
WHEN '\x5663e3E096f1743e77B8F71b5DE0CF9Dfd058523' then 'Pooly_Judge'
END as NFT_name,
nfts_purchased,
CASE maxNFT_Supply
WHEN '\x90B3832e2F2aDe2FE382a911805B6933C056D6ed' then 10000
WHEN '\x3545192b340F50d77403DC0A64cf2b32F03d00A9' then 100
WHEN '\x5663e3E096f1743e77B8F71b5DE0CF9Dfd058523' then 10
END as NFT_Supply,
CASE maxNFT_Supply
WHEN '\x90B3832e2F2aDe2FE382a911805B6933C056D6ed' then 100-(nfts_purchased/10000.0*100)
WHEN '\x3545192b340F50d77403DC0A64cf2b32F03d00A9' then 100-(nfts_purchased/1000.0*100)
WHEN '\x5663e3E096f1743e77B8F71b5DE0CF9Dfd058523' then 100-(nfts_purchased/10.0*100)
END as percent_supply_remaining
from poolyContracts
left join
(
Select contract_address as maxNFT_Supply
From erc721."ERC721_evt_Transfer"
Where (contract_address = '\x90B3832e2F2aDe2FE382a911805B6933C056D6ed'
or contract_address = '\x3545192b340F50d77403DC0A64cf2b32F03d00A9'
or contract_address = '\x5663e3E096f1743e77B8F71b5DE0CF9Dfd058523')
and "from" = '\x0000000000000000000000000000000000000000'
group by 1
)
as maxNFT
on maxNFT_Supply = contract_address
ORDER BY 3 desc
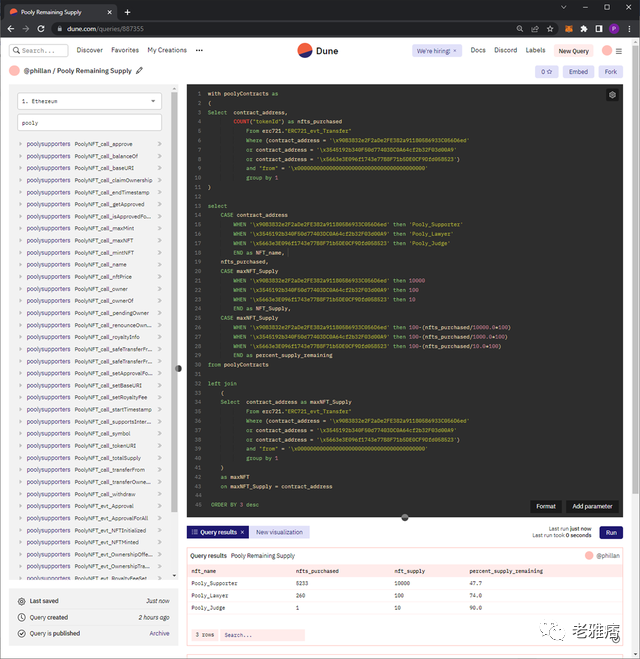
image description
Pooly NFT Supply Inquiry
This is where you have to get a little creative. Manually adding numbers to specific table entries in SQL is a daunting task, I had to apply some tricks to get this in order to leave an easy to read table.
The reason for the second table is that SQL doesn't allow you to call the column twice in a single query. In practice, we need to call a column multiple times, and convert each column call separately. However, join tables allow us to call columns in the second table multiple times, allowing us to create the desired output for a specific row in the column we need.
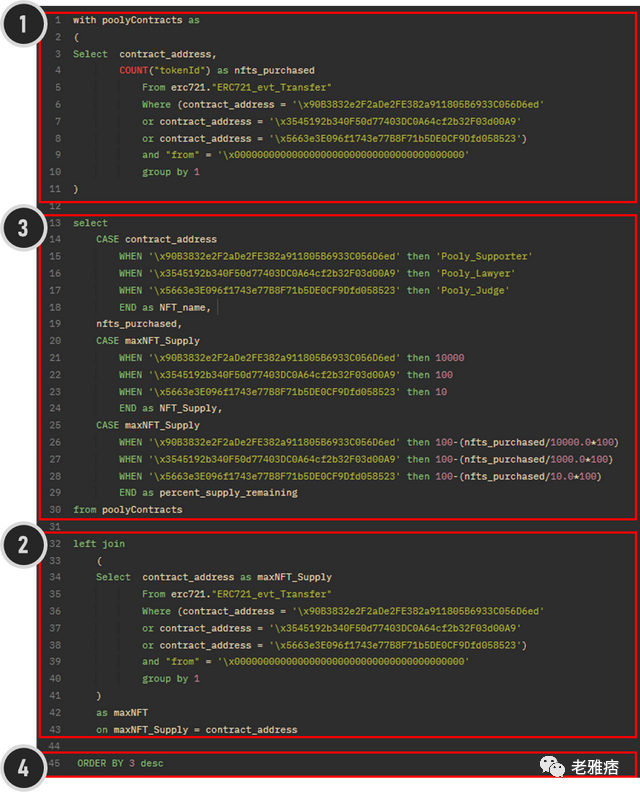
image description
A breakdown of the above query
Let's break this query into four parts for easier digestion.
Pay attention to the order! 1, 3, 2, 4!
In this section, we define a table called "poolyContracts" in which we count all individual tokenIds from empty addresses of the three Pooly contract addresses, thus only including NFTs minted using the erc721."ERC721_evt_Transfer" table. We then group them by the first column, thus returning the minted NFT for each pool smart contract.
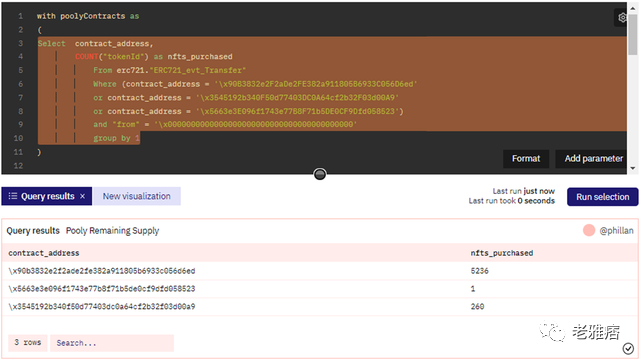
image description
poolyContracts table
In this code block, we force the query to only show each of the three contract addresses. We do this by using the "group by 1" command, which groups the results by the unique entries of the first column.
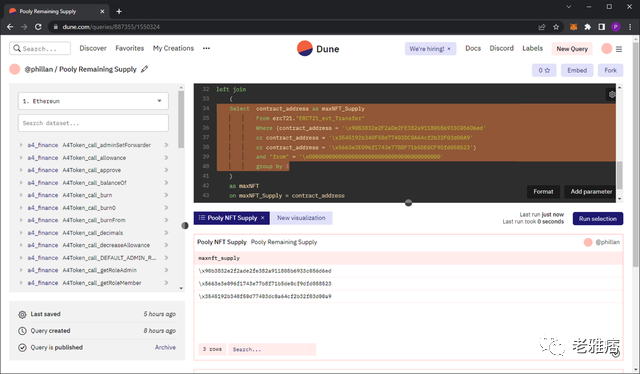
image description
Without the group by command, the query would return all transfer events related to these contract addresses, but we only need one occurrence of each. You'll see why in the next section.

image description
The second table returns a long list of contract addresses without the "group by 1" command
Also, we renamed the contract_address column to maxNFT_Supply so that we can define which column to join this table with in the poolyContracts table.
Section 3
This is where the magic happens.
In this section, we can now call columns from the join table. We call it:
nfts_purchased
maxNFT_Supply
maxNFT_Supply
Contract address
Next, you'll also notice that columns 1, 3, and 4 have embedded CASE WHEN clauses. Because each of the first two tables we created has only one unique row for each smart contract, we cannot use the CASE WHEN statement to specify whether a particular smart contract address occurs (one of the three options), in which Location returns something else.
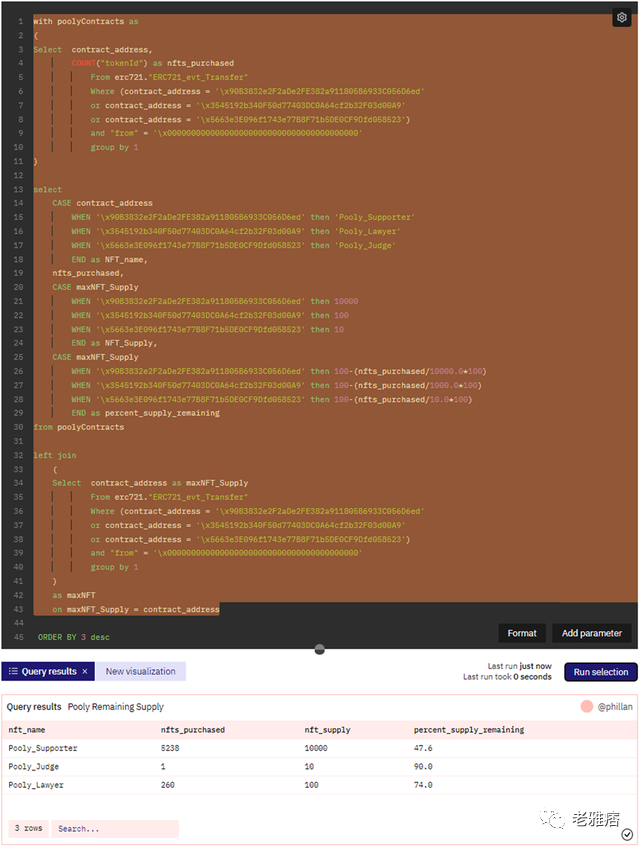
image description
Full table of results not sorted by nft_supply
You'll see the first column here, we're telling the query editor to replace each smart contract address with the name of the corresponding NFT!
In the third column, we replace it with the largest known number of NFTs listed on the Pooly website.
In the fourth column, we use a formula to calculate the percentage of the remaining NFT supply. In these statements, at least one number used for arithmetic operations needs to contain a decimal place. If this is not included, the SQL query will be interpreted as wanting to return integers, which means we won't get any decimals for these calculations. By including ".0", we are indicating to the server that we want this calculation to return a decimal number.
Finally, we indicate that we want the output to be sorted in descending order (largest to smallest) by the third column.
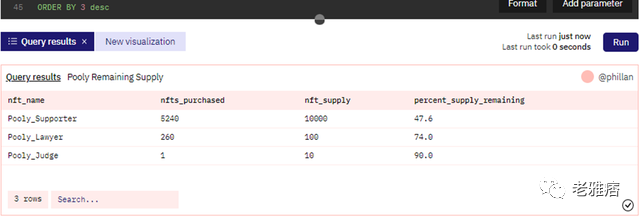
image description
This table is also ready. Save your query, make any desired changes to the table and add it to the dashboard.
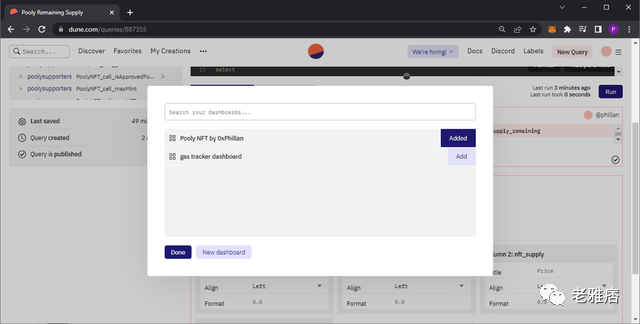
image description
Add table to dashboard
In our final query, we will create a time series graph showing the amount of ETH raised through NFT sales over time.
select
block_time as time,
sum(value/1e18) over (order by date_trunc('minute', block_time) asc) as cumu_value_eth
from ethereum.transactions
where ("to" = '\x90B3832e2F2aDe2FE382a911805B6933C056D6ed'
or "to" = '\x3545192b340F50d77403DC0A64cf2b32F03d00A9'
or "to" = '\x5663e3E096f1743e77B8F71b5DE0CF9Dfd058523')
and date_trunc('day', block_time) < '2022-06-25’