As shown in the figure, based on the key indicators of TVL (total locked value), FDV (full circulation market value) and TVL/FDV ratio, we can roughly judge the "plate size", market expectations and whether there is "underestimation potential" of these public chains.
Simply put, TVL represents the amount of money coming in, FDV is the pie that the market paints for this project, and TVL/FDV is to see whether this pie is real or fake. Let's break them down one by one.
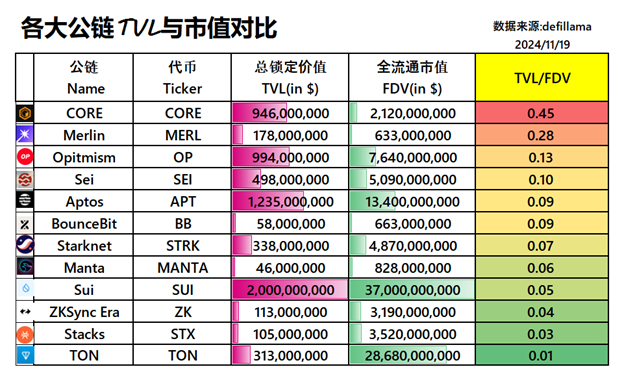
1. TVL——The higher the locked amount, the more money the ecosystem attracts
This is the most intuitive indicator. The amount of money locked represents how well the ecosystem can support people.
From the table:
Sui has locked up 2 billion US dollars, which is indeed a high number, but don’t worry, wait and see what FDV says.
Aptos and Optimism have locked up nearly 1 billion each. These two ecosystems seem to be quite stable, and the funding activity is high.
Although Merlin only has 178 million, it is not at the bottom of the list and its ability to attract money is not bad.
2. FDV: Is the pie realistic enough?
FDV is the market's "market value expectation" for the project. If the pie is too big but the funds cannot keep up, it is the "bubble danger zone"; if the pie is moderate and the proportion of locked funds is high, it is a "potential stock".
Take a look at these projects:
Sui’s FDV soared to 37 billion, but the 2 billion TVL can’t support it. This is definitely “big pie in the sky, but the funds are not there”. The risk is not small.
TON's FDV is 2.8 billion, and its TVL is only 300 million. This ratio is ridiculously low, and it seems like it is being supported by sentiment and hype.
In contrast, Merlin’s FDV is only 633 million, but its TVL is 178 million, which shows that the market’s expectations for it are not outrageous and there is still a lot of room for growth.
3. TVL/FDV——Is it real strength or just empty talk?
This ratio is the proportion of locked funds to expected market value. The higher it is, the higher the capital efficiency and the more solid the development.
Let’s take a look:
CORE (0.45): This ratio is directly ranked as the best on the list. There is a lot of money coming in, but the pie is small, and there is basically no bubble. If the capital inflow continues to grow, the explosiveness will be obvious at a glance.
Merlin (0.28): Ranked second, it has a good proportion of locked funds, the pie is not too big, it is steady and cautious, and is quite suitable for ambushes.
Optimism (0.13) and Sei (0.10): They are average, not underestimated, but there is nothing special about them either. They are considered to be the “conservatives” among the mainstream public chains.
Sui (0.05) and TON (0.01): These two directly pull TVL/FDV to the bottom. The market expects it to be the ceiling, but the locked funds are poor. It looks more like a bubble and is not suitable for chasing highs.
Those with a high TVL/FDV ratio have small bubbles and potential; those with a low ratio have large bubbles and you need to be careful.
Combining the above data:
High-potential players: CORE and Merlin, both have high capital utilization rates, reasonable pie-in-the-sky drawings, and a stable ecosystem, making them particularly suitable for mid-term ambushes.
The old hands who seek progress while maintaining stability: Optimism and Aptos. They have large locked-up funds. Although the pie is a little too big, the ecosystem is still expanding. They are definitely large-cap blue chips.
Suspected bubble candidates: Sui and TON. These two are too “lazy”. If they only rely on FDV to paint a rosy picture without more TVL support, they are likely to be unpopular or their valuations will shrink in the future.