Original author:Web3Go
introduction
introduction
Moonbeam Overview DashboardLink
On the occasion of the first anniversary of the launch of Moonbeam, as an early supporter and builder of the Moonbeam Network ecosystem, Web3 Go is honored to present the Moonbeam Overview Dashboard we developed to the Polkadot community as the first in the ecosystem to integrate Substrate and EVM data sources Dashboard, we hope to show users, ecological supporters, developers and investors a real and vivid Moonbeam Network ecological panorama through the data level.
first level title
1. Overview
Before reviewing Moonbeam's data last year, let's take a look at the Moonbeam Overview Dashboard structure developed by Web3 Go. The data dashboard consists of seven major sections and supports real-time updates at the second level. These seven major sections include:
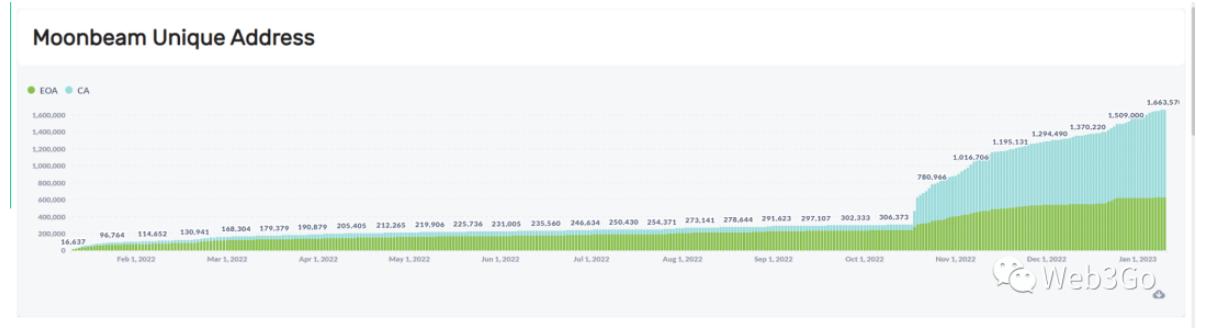
2. Moonbeam Unique Address
This module contains 6 core data on the Moombeam chain.
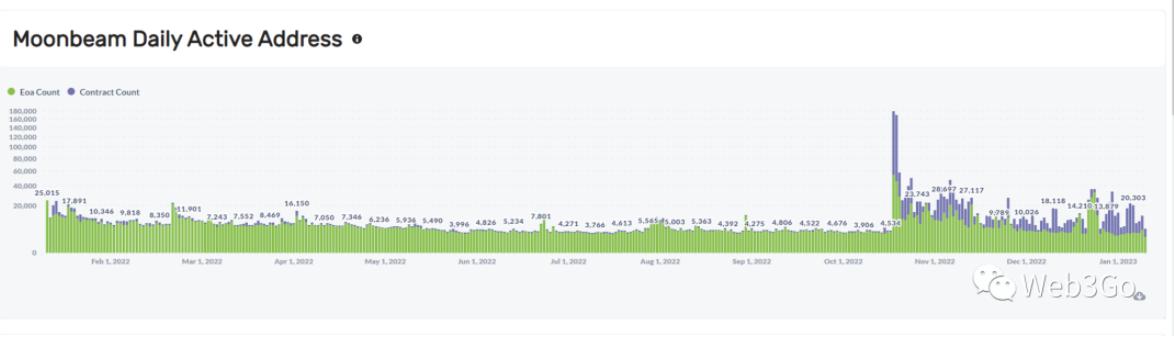
3. Moonbeam Daily Active Address
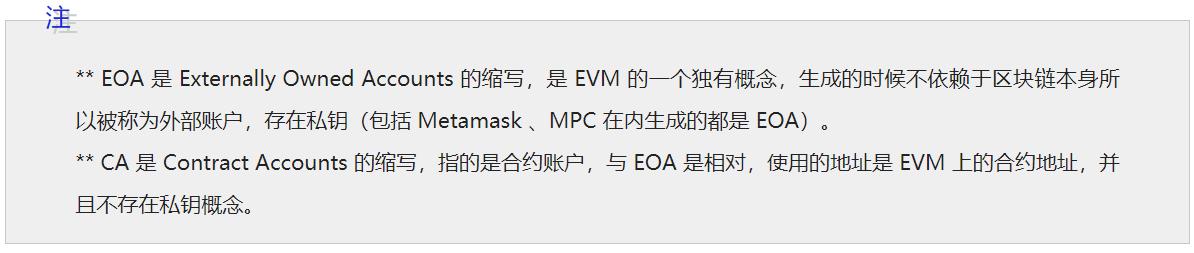
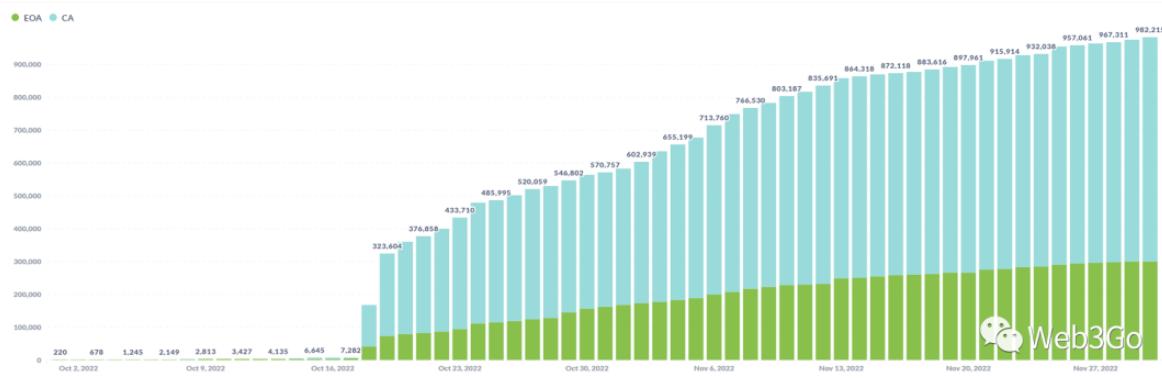
This module is used to display the comparison of the total amount of EOA and CA on the Moonbeam chain, which can reflect the scale of users and protocols on the chain to a certain extent.
4. Transaction Breakdown By Layers
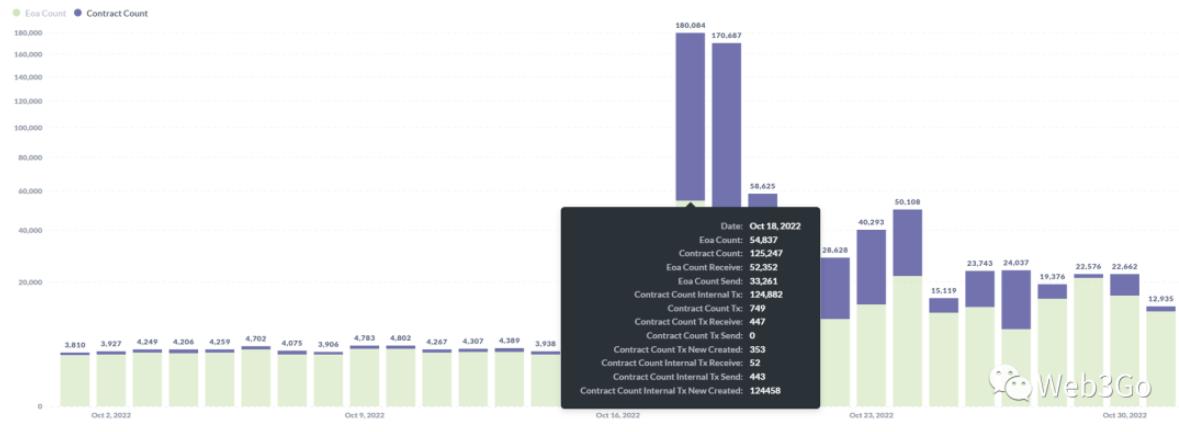
This module is used to display the trend of active EOA and CA on the Moonbeam chain, from which you can learn about the active status of user addresses and contract accounts on the chain.
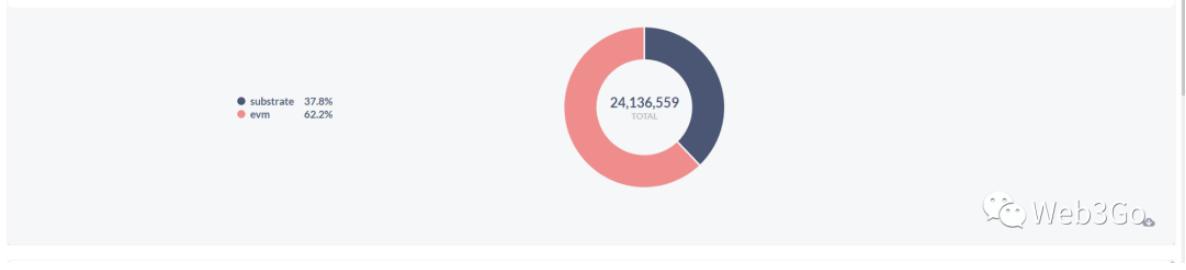
5. Substrate Transaction Category Breakdown
This module is used to display the source of Transaction on the Moonbeam chain (Evm or Substrate).
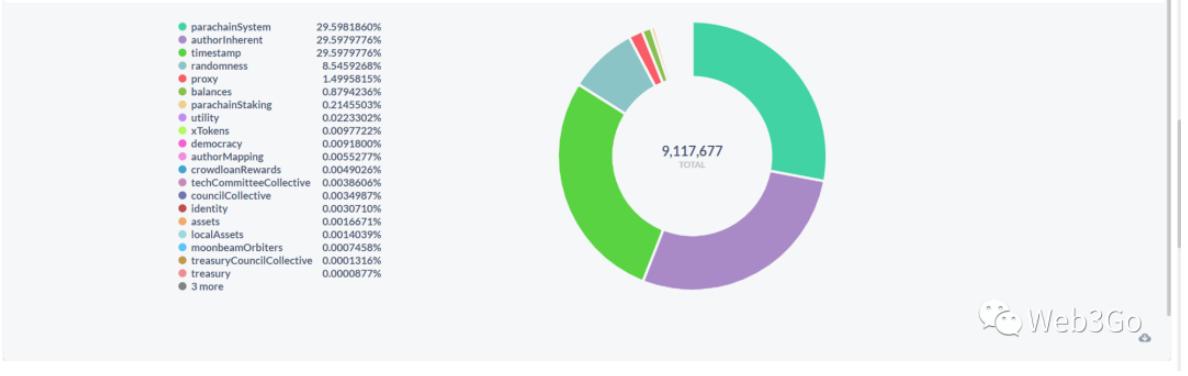
6. Transaction Daily Trend
Combined with the previous module, this module is used to display the call ratio of each sub-module of Substrate Transaction.
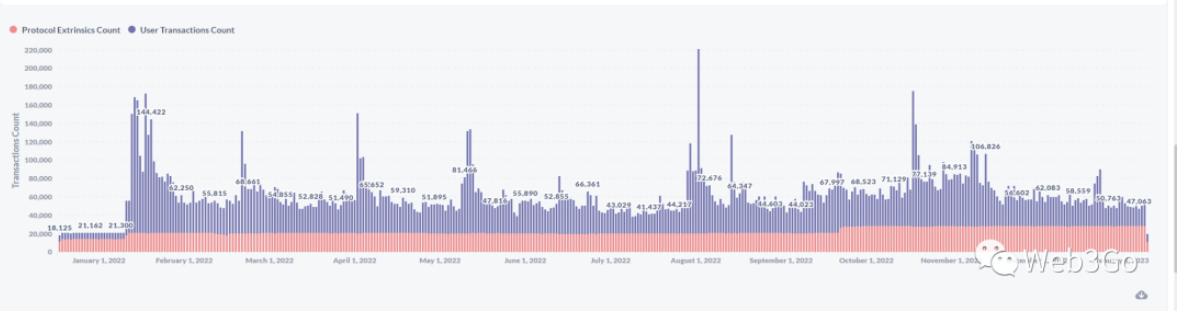
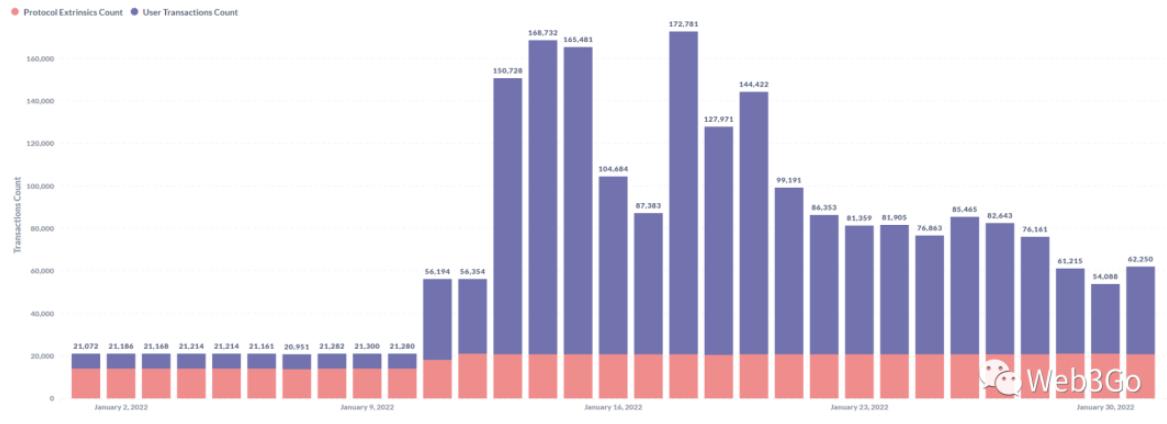
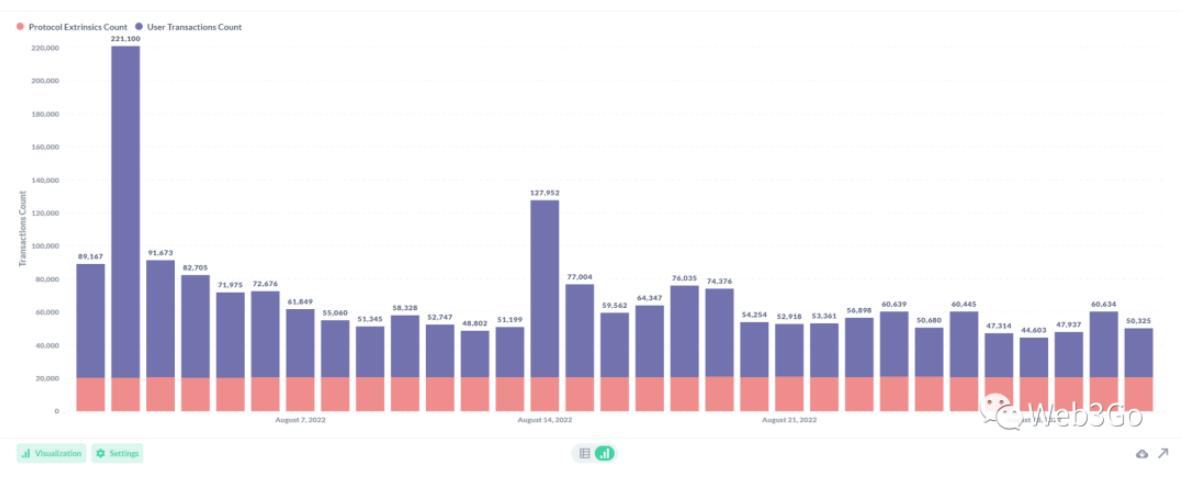
7. Transaction Daily Stack
This module is used to display the daily change trend of Transaction on the Moonbeam chain whose sources are Protocol and User respectively.
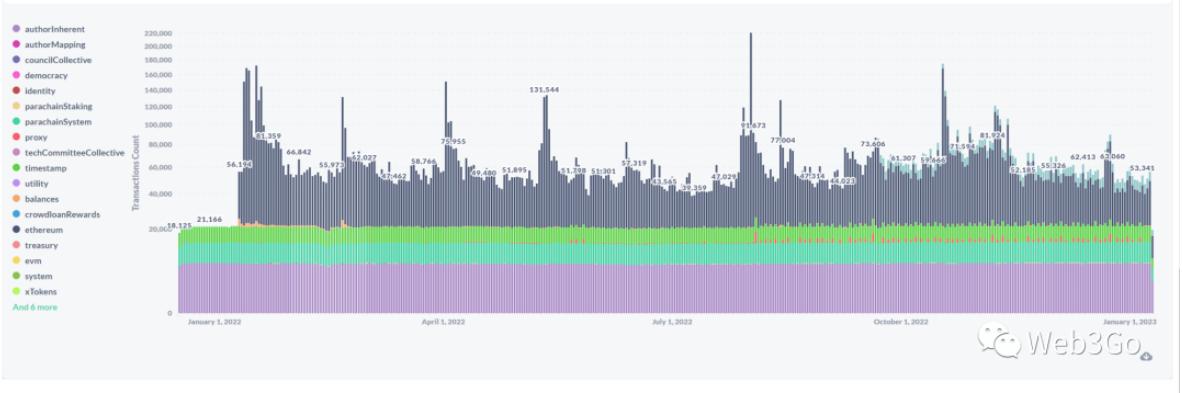
secondary title
This module is used to display the daily usage of each sub-module by Transaction on the Moonbeam chain.
first level title
Daily data
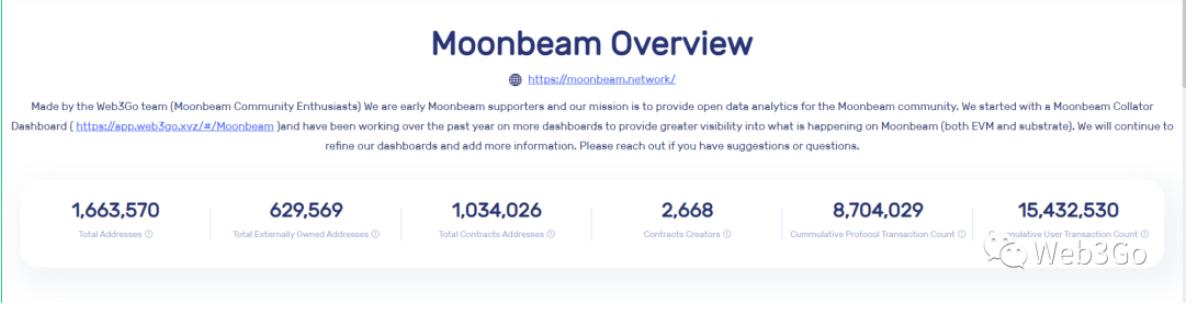
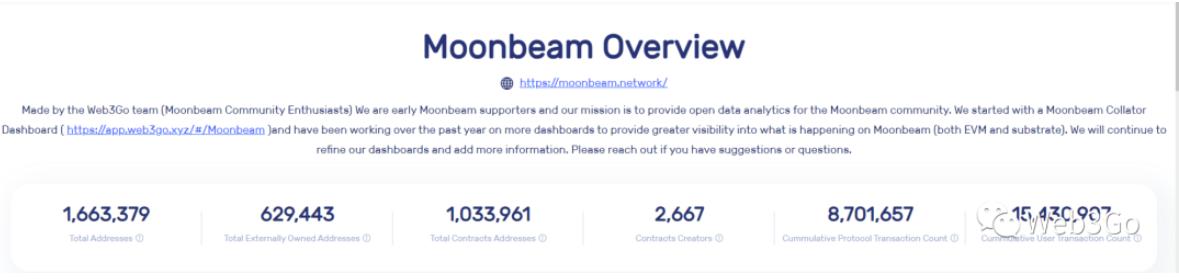
As of 2023/01/10 7: 56 (UTC) Moonbeam Network has delivered an excellent result of 1.66 million total addresses in the past year, of which contract addresses (Contracts Addresses) accounted for 62%, and more than 2,600 independent contract creators.
Further analysis of the data trend shows that in mid-October last year, the proportion of CA on Moonbeam was only about 20%, but in less than a month, the CA data had an explosive growth of nearly 10 times. What exactly happened in ?
The contributions to the ecology of the Moonbeam Foundation, the community, and external forces have become the main driving force for the explosive growth of data. In mid-October, the Moonbeam community took advantage of the opportunity of the two largest DeFi protocols in the ecology, StellaSwap and Moonwell, to pass incentive proposals. Activities that activate the entire ecological liquidity——Moonbeam Ignite, a series of market activities including AMA, hackathon, and NFT Campaign have greatly improved the community's sense of construction and participation.
The entire event was allocated 12 million GLMRs (worth about $5 million at the time) by the Moonbeam Foundation. StellaSwap and Moonwell shared liquidity incentives, and all rewards were distributed in 24 weeks.
Link
In addition, the XEN team, a popular token in October, also announced on the 19th that it is expected to achieve technical integration with the Moonbeam network. XEN, as a gas fee burning machine, when ETH and BSC went online, users scrambled to mint XEN and set off a short Gas war. Currently the XEN team is still actively preparing for the deployment to the Moombeam network.
It is still October, and Moonbeam vigorously promotes the concept of Connected Contracts, aiming to let more developers know that Moonbeam's vision is to become the main entrance for applications to enter the Polkadot ecosystem, and to make parachains the underlying solution, so as to make the Moonbeam ecosystem Developers can better benefit from the Substrate framework.
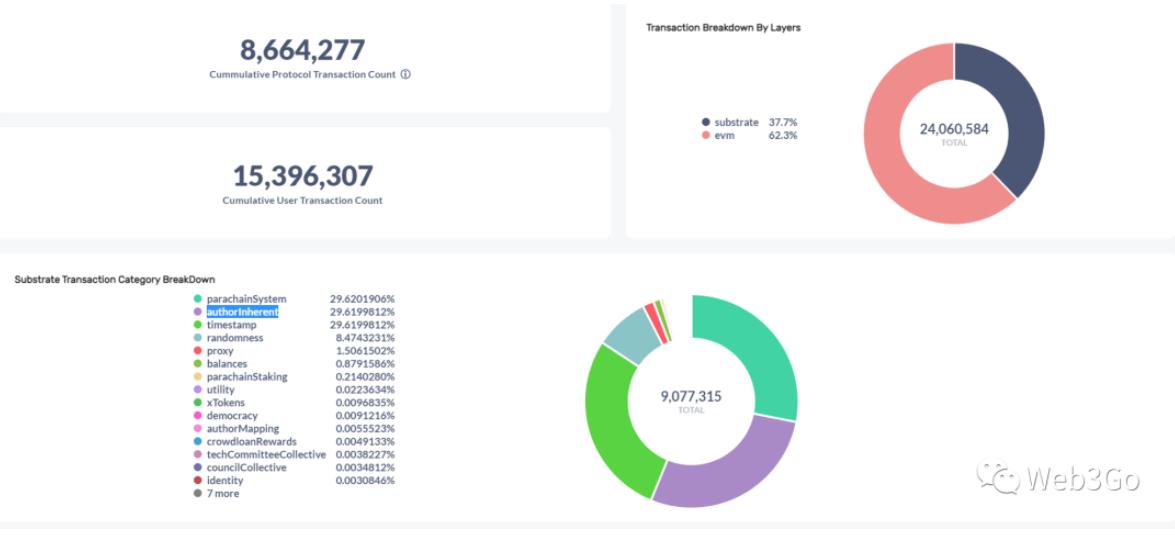
In addition to ecological development, Moonbeam has also made a huge breakthrough in the application of the most critical chain activity index. From the Transaction data, we can see that as of 2023/01/10 7: 56 (UTC), most of the Transactions in Moonbeam come from EVM, while the Transactions under Substrate account for nearly 40%.
Summarize
According to the data captured by Web3 Go, Moonbeam went from 0 EVM interactions at the beginning of the year to a peak EVM block output of 200,000 in early August, and since then, the EVM Txn daily data has remained stable at more than 150,000. It can be seen that Moonbeam has been practicing the promise of the new cross-chain paradigm of Connected Contracts. Developers can enter the Moonbeam ecosystem and build applications with almost zero friction without giving up its native ecology (EVM). Low friction is not only reflected in the network In terms of fee rates, it is more reflected in the cross-chain experience of developers, and finally these are intuitively reflected in the proportion of active EVM Txn.
first level title