The exchange "giant" FTX became insolvent and eventually went bankrupt, and implicated a number of exchanges, investment institutions, market makers and other crypto companies that had close contacts with it into crisis, which not only triggered a sharp "diving" of crypto asset prices, This has made the market that has been fluctuating downward since April this year more vulnerable, and further tightened market liquidity.
What impact does the "FTX event" have on market changes? Will it accelerate the market bottoming out? What is the current liquidity in the market? PAData conducted an in-depth interpretation of 8 market data and found that:
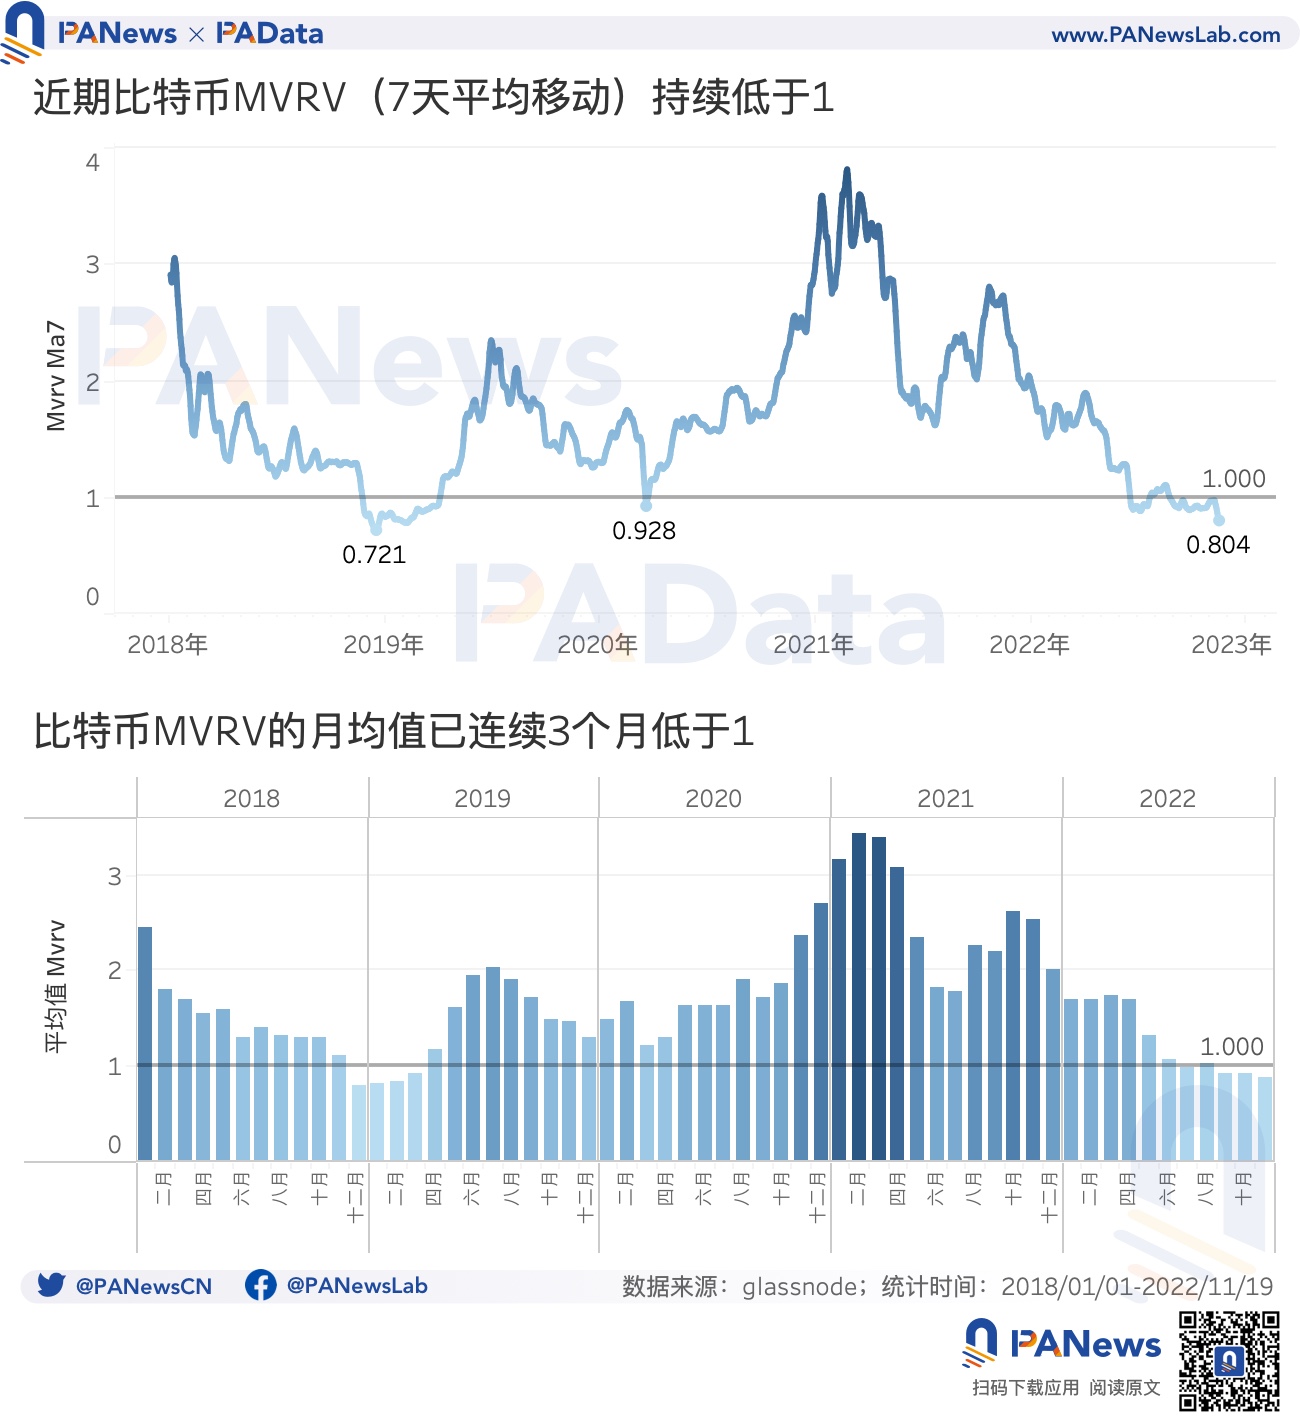
1) This year, the Bitcoin MVRV indicator has been below 1 for 88 consecutive days, falling to 0.804 on November 15th, the second lowest value in the last 5 years. Compared with the end of 2018, the indicator has bottomed out, but it still needs to run at the bottom for a while.
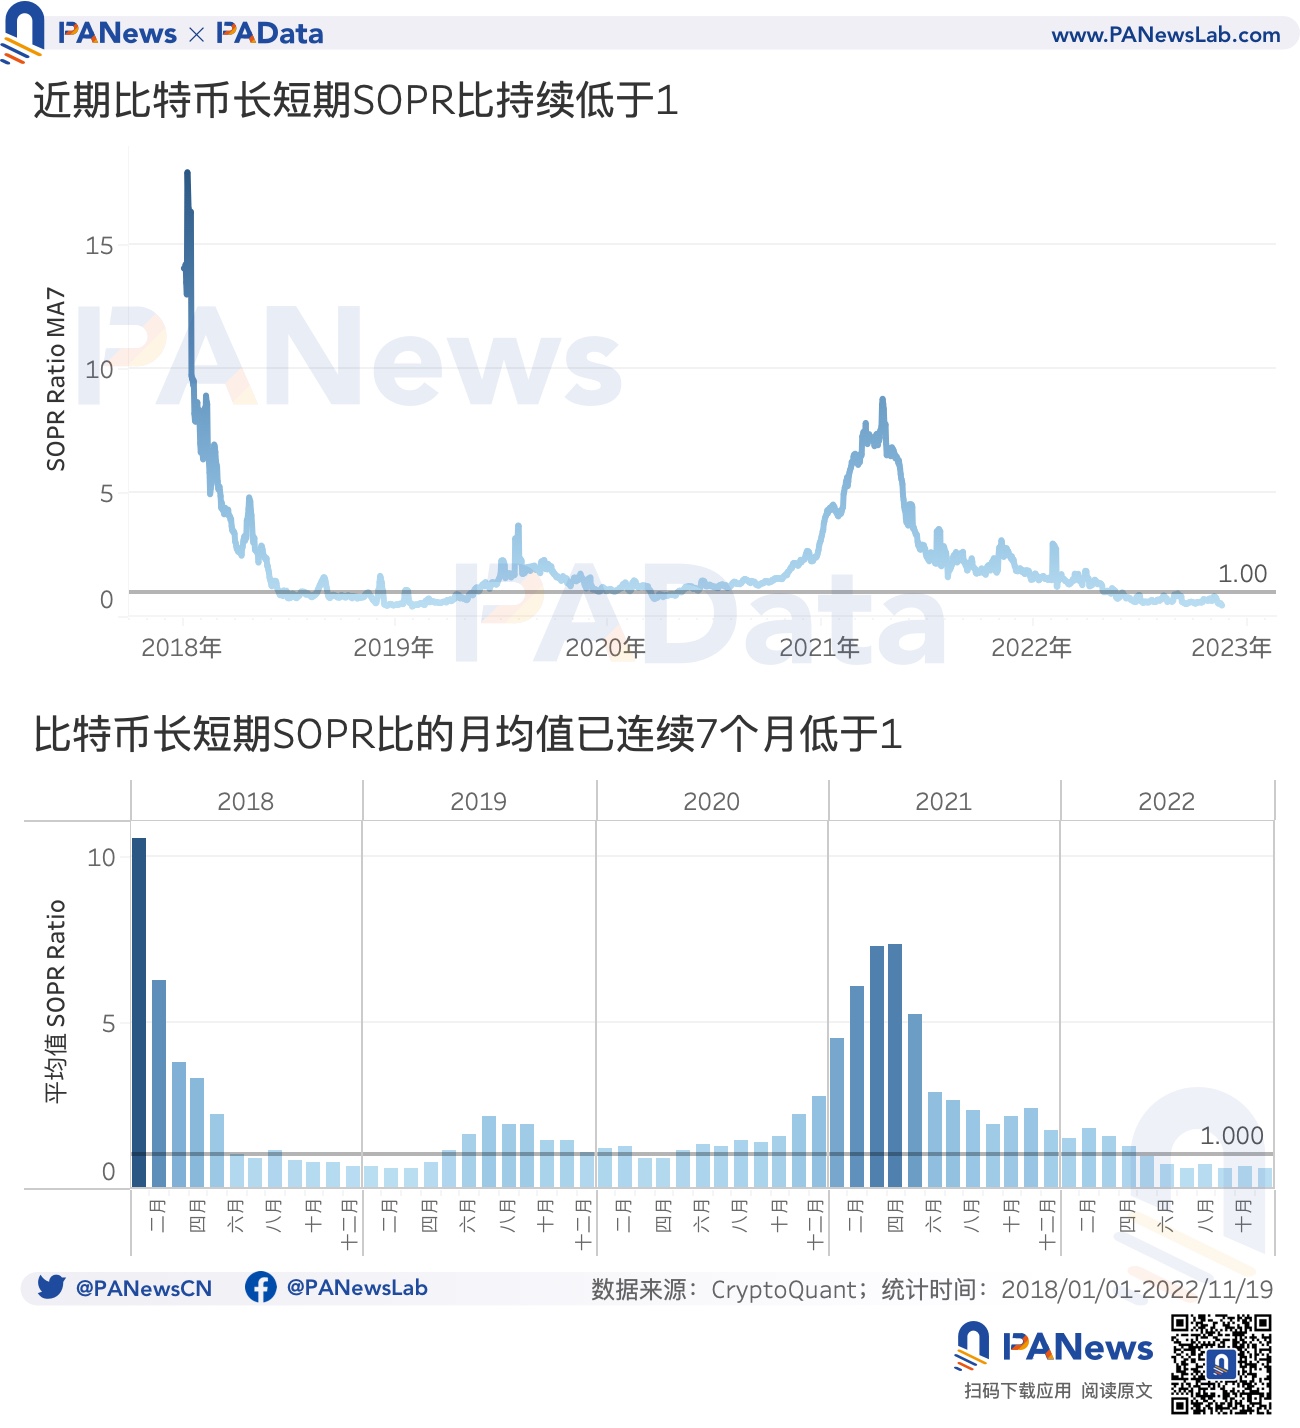
2) The SOPR ratio of Bitcoin's long-term and short-term chips has been lower than 1 for 183 consecutive days, and the monthly average has been lower than 1 for 7 consecutive months, which means that the profitability of BTC short-term chips is much higher than that of long-term chips in the near future. In terms of duration, it is only one month shorter than the bear market cycle at the end of 2018.
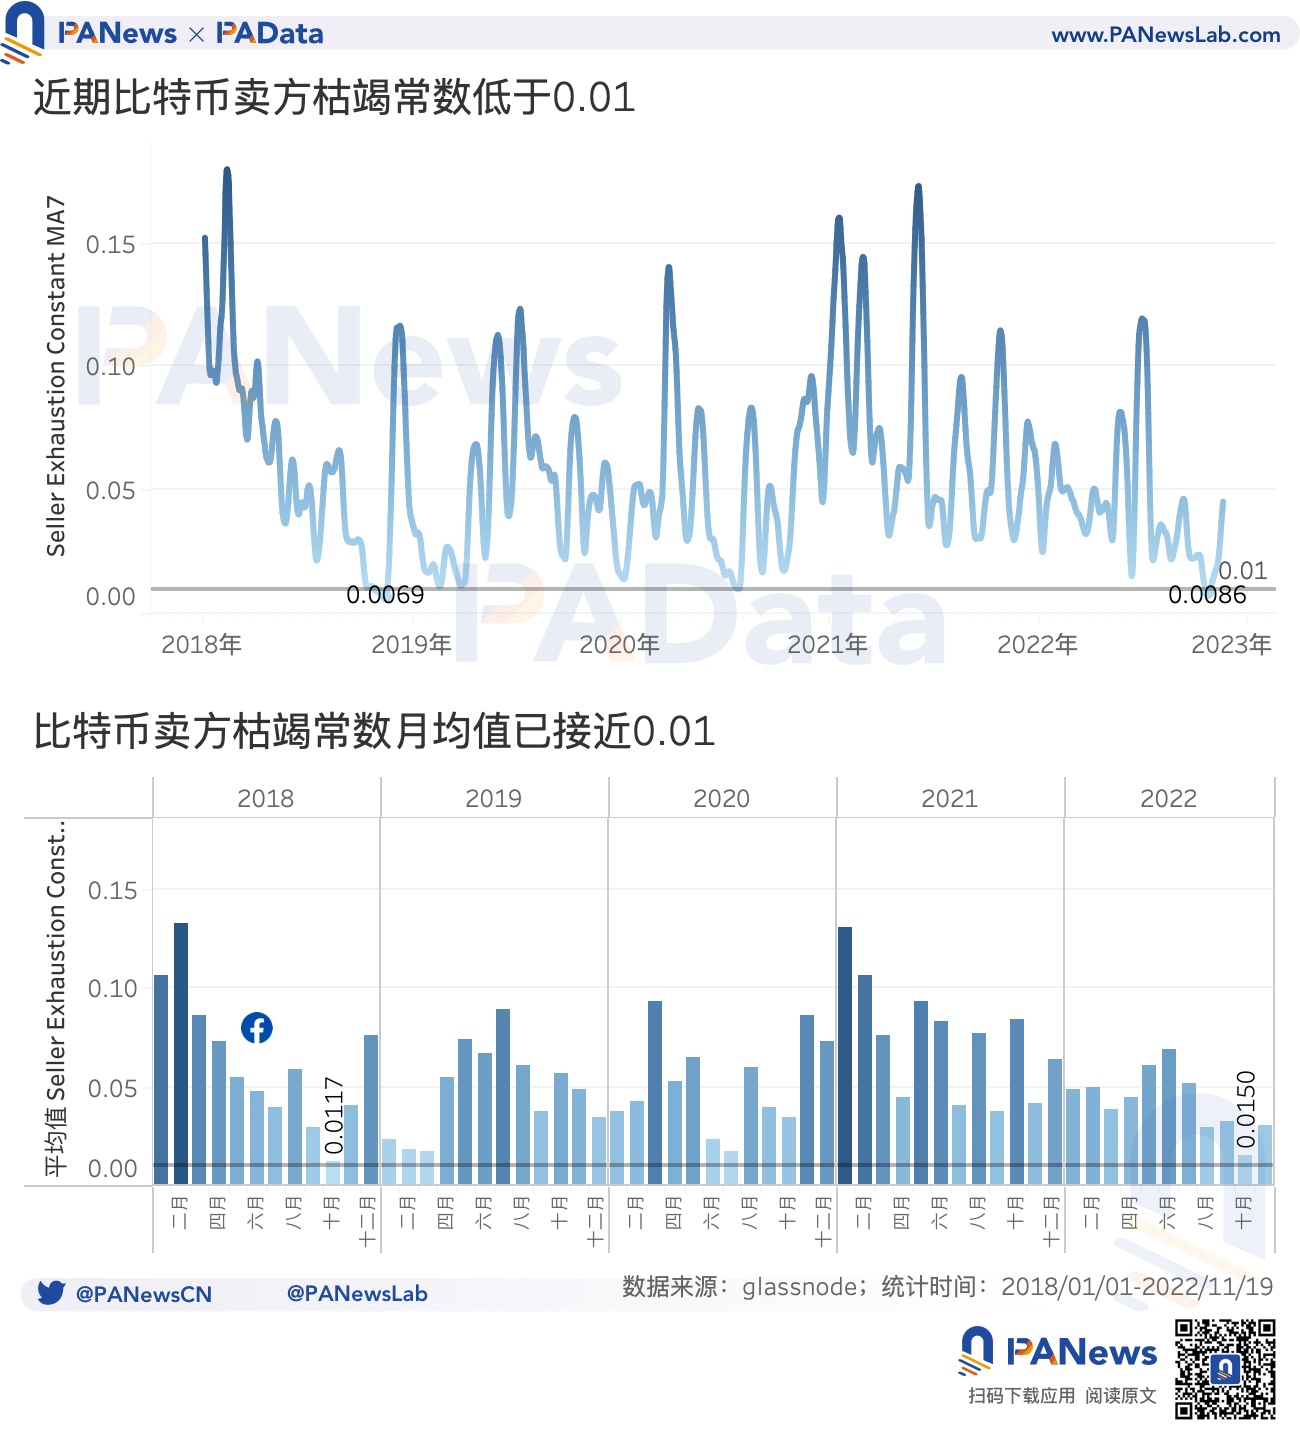
3) The monthly average value of Bitcoin’s seller exhaustion constant was very close to 0.01 in October this year and October 2018. If combined with the currency price trend, the low level of the seller exhaustion constant in 2018 was earlier than the currency price bottomed out. If we speculate from this, Then there may still be room for the current currency price to go down.
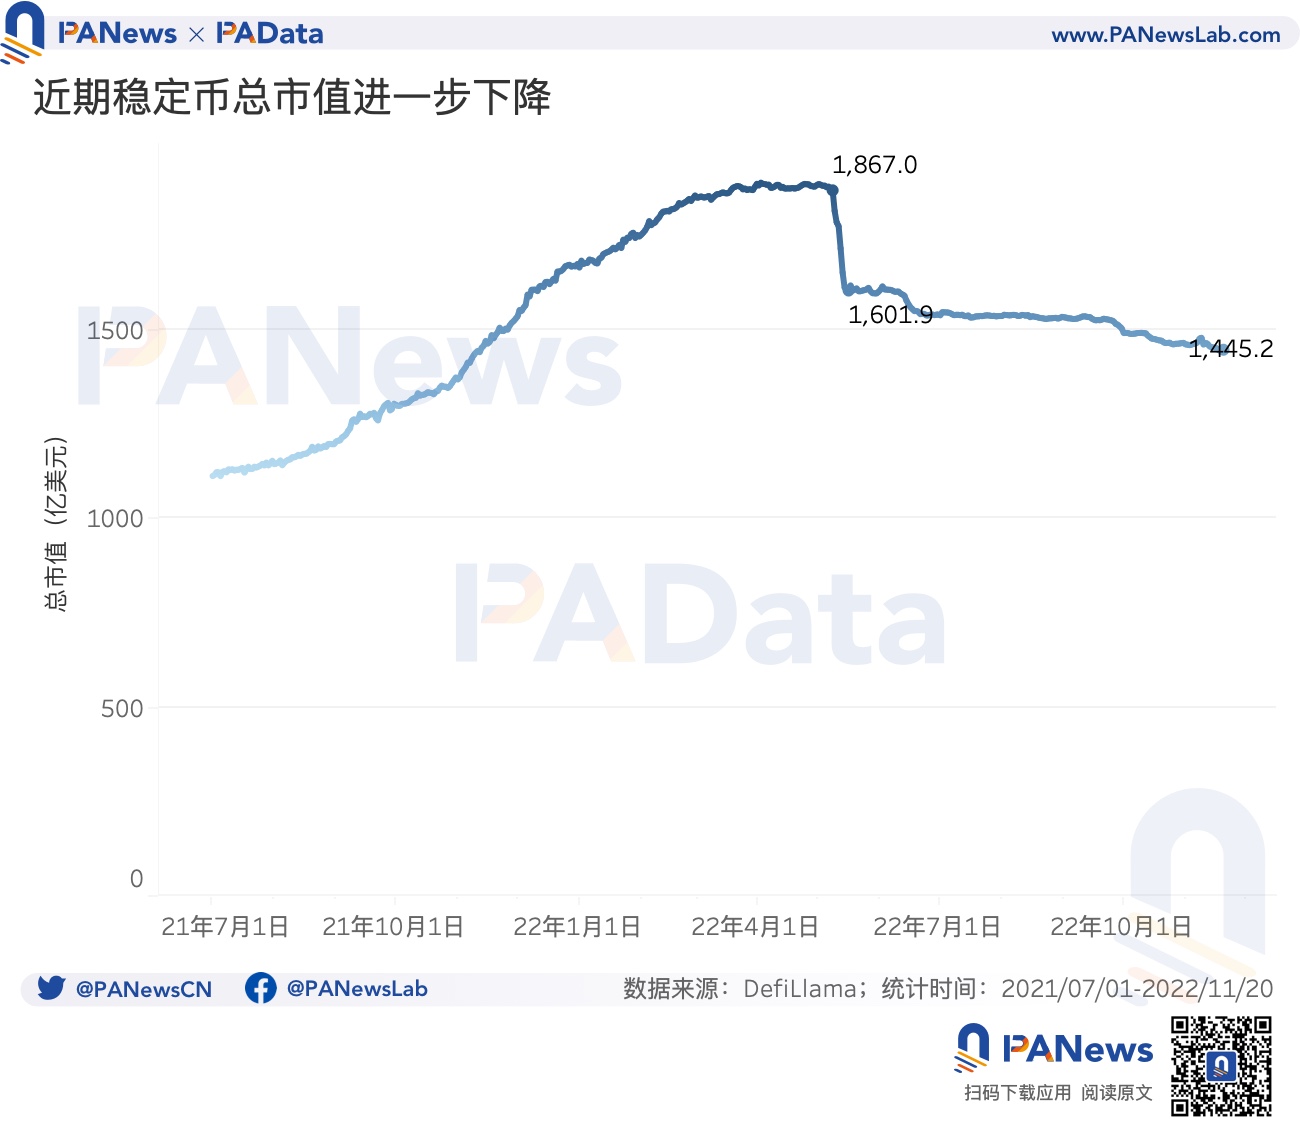
4) On November 20, the total market value of stablecoins in the market was approximately US$144.52 billion, a decrease of US$1.97 billion from November 7. On November 19, the stock of stablecoins on exchanges was approximately $30.35 billion, a decrease of $5.5 billion from November 4.
first level title
01
text
According to the data of CoinGecko, Bitcoin is still the most important asset in the encryption market at present, and its market value accounts for 37.2% of the total market value. Therefore, considering the market indicators of Bitcoin is of great significance to understand the changes in the entire market. Judging from the three data of Bitcoin’s market value and realized value ratio, long-term and short-term chip SOPR ratio, and seller exhaustion index, the market is already at a level comparable to the bear market at the end of 2018.
Market Value to Realized Value (MVRV) is a commonly used indicator to judge whether the current market price of an asset is lower than the "fair price" at the time of transaction. If MVRV is lower than 1, it means that the current market price is lower than the "fair price" when the chip is traded, and the market price is undervalued, otherwise it means that the current market price is overvalued.
On November 19th, Bitcoin’s MVRV index (7-day average) had fallen to 0.809, and on November 15th a few days ago, this index fell to 0.804, the second lowest value in the past 5 years. It was just above the all-time low of 0.721 set on Dec. 16, 2018. In the bear market cycle that started at the end of 2018, the number of days that the Bitcoin MVRV index (7-day average) was below 1 was 132 days. From this perspective, the Bitcoin MVRV index (7-day average) may have bottomed out, but it still needs to run at the bottom for a while.
SOPR (Spent Output Profit Ratio) is a direct indicator to observe whether each chip is profitable when trading. The long-term and short-term chip SOPR ratio can measure whether the market's medium- and long-term chips (holding currency for more than 155 days) have high output profits or short-term chips (holding currency greater than 1 hour and less than 155 days) the output is highly profitable. The higher the ratio, the higher the profit margin of long-term chips, which usually occurs at the top of the market, and the opposite means the higher the profit margin of short-term chips, which usually occurs at the bottom of the market.
On November 19, the SOPR ratio (7-day average) of Bitcoin’s long-term and short-term chips was about 0.47, which was significantly lower than 1, which was comparable to the level from the end of 2018 to the beginning of 2019. And since May 21 this year, this indicator has been lower than 1 for 183 consecutive days, and the monthly average has been lower than 1 for 7 consecutive months, which means that the profitability of short-term BTC chips is much higher than that of long-term chips in the near future. And in terms of duration, it is only one month shorter than the bear market cycle at the end of 2018.
The seller exhaustion constant (Seller Exhaustion Constant) is defined as the product of the profit chip ratio and the 30-day price volatility. The lower the value, it means that the profit chip ratio and the 30-day price volatility are both low, which means high loss and low volatility rate at the same time, which usually occurs at market bottoms.
Based on history, Bitcoin's seller exhaustion constant (7-day average) is below 0.01, and it is likely to bottom out. The last time the index was below 0.01 occurred on October 24, at around 0.0086, which is comparable to the level seen in mid-November 2018. From the monthly average, only October this year and October 2018 are very close to 0.01. If combined with the currency price trend, the low of the seller exhaustion constant in 2018 was earlier than the currency price bottomed out. If we speculate from this, there may still be room for the current currency price to go down.
02
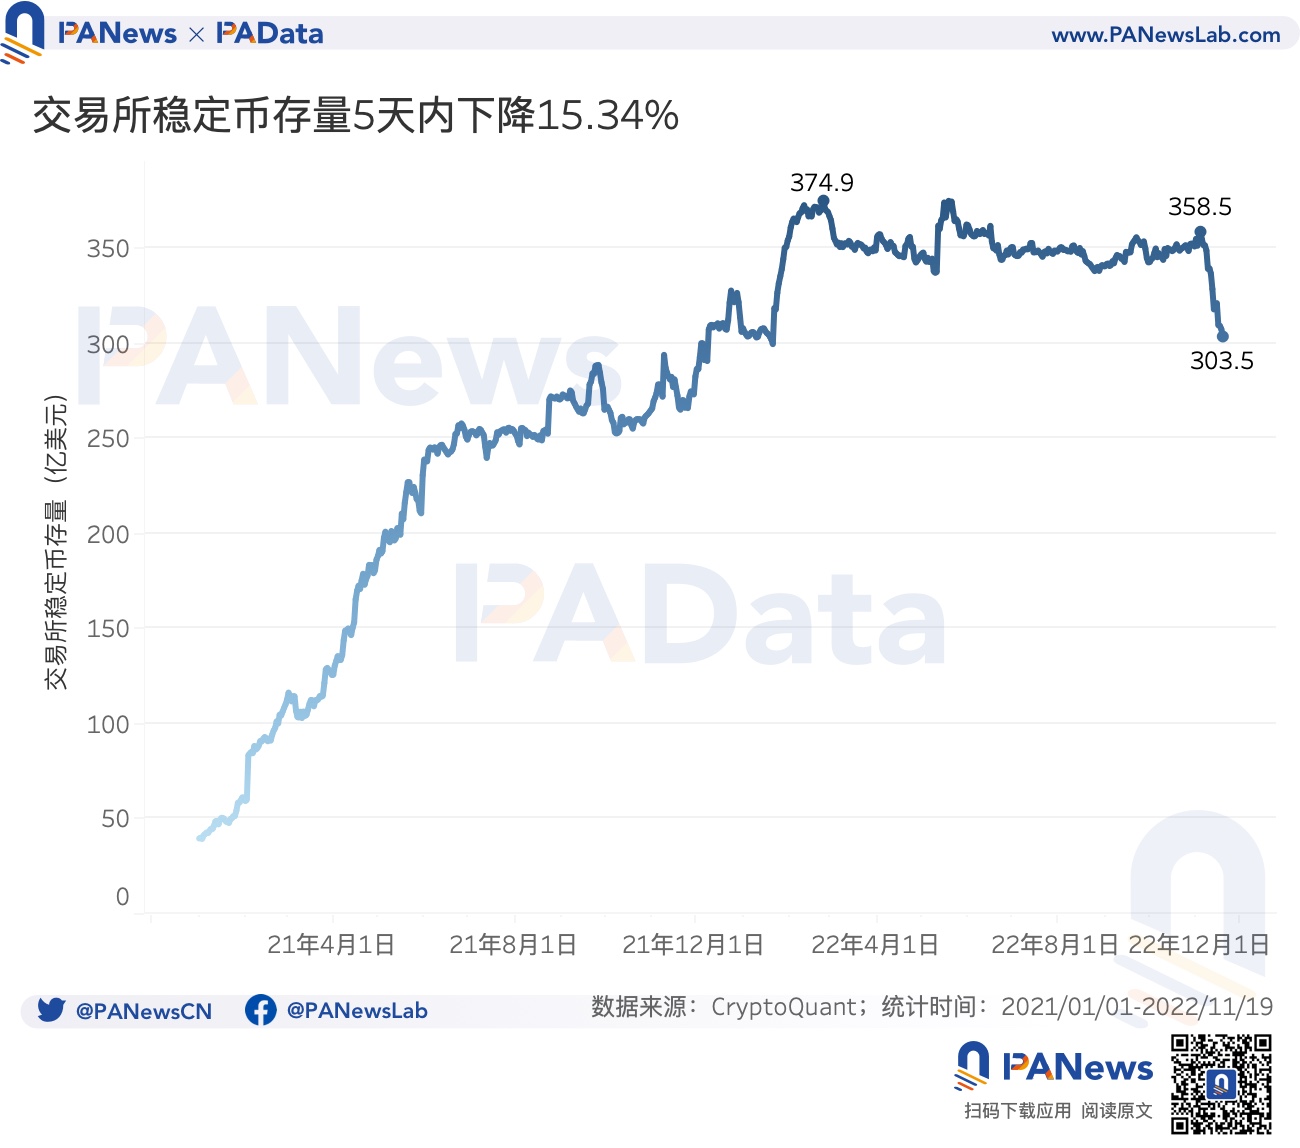
The stock of stablecoins on the exchange decreased by US$5.5 billion in 6 days, and the liquidity of CEX further decreased
The FTX incident has spread widely, and many crypto companies that have close business dealings with it are also in crisis, which aggravates the market's concerns about liquidity. The market value of stablecoins is an intuitive window to observe market liquidity. The rise in the market value of stablecoins is usually accompanied by an upward trend in the market and an increase in buying demand, and vice versa.
According to statistics, as of November 20, the total market value of stablecoins in the market was approximately US$144.52 billion, which was US$1.97 billion "shrunk" from US$146.49 billion when the FTX incident occurred on November 7. The high point of 186.70 billion U.S. dollars was "shrunk" by 42.18 billion U.S. dollars. From the perspective of day-to-day changes, the day-to-day change of the total market capitalization of stablecoins on November 10 was -1.22%, which was the largest day-to-day drop in the past five months. It can be seen that since May this year, the total market value of stablecoins has been in a downward trend, but the FTX incident has exacerbated this trend.
Changes in the stock of stablecoins on exchanges can also confirm this speculation from the side. On November 19, the stock of stablecoins on exchanges was approximately US$30.35 billion, a decrease of US$5.5 billion from the short-term high of US$35.85 billion on November 4. 6 The daily decline is about 15.34%. This broke the stable and slight decline in the stock of stablecoins on the exchange this year, and brought the liquidity on the exchange back to the level at the beginning of the year.
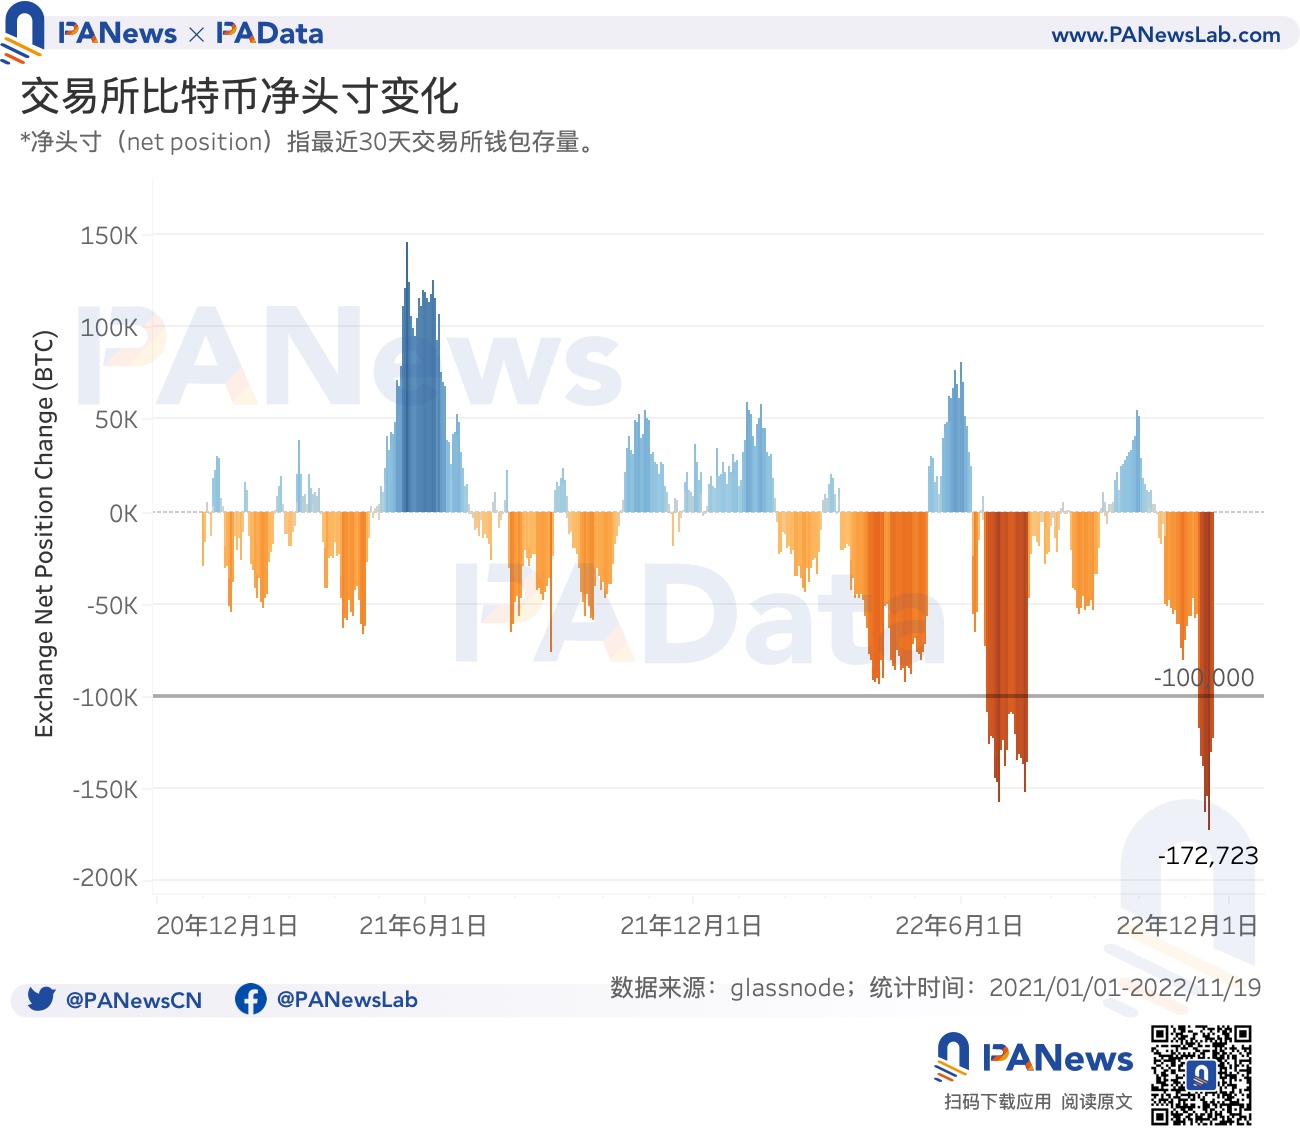
It is also worth noting that the net position change of Bitcoin in the exchange wallet (Exchange Net Position Change), that is, the change in the balance stock in the last 30 days, has also undergone significant changes. According to statistics, on November 16, the exchange’s net Bitcoin position decreased by 172,700 BTC, which was the largest single-day change in the past two years. Moreover, since November 10, the exchange’s net bitcoin position has decreased by more than 100,000 BTC for 10 consecutive days. In fact, since the second half of this year, the stock of Bitcoin on exchanges has continued to decline, but the recent FTX incident has accelerated this process.
03
The lock-up volume of Uniswap's main trading pool decreased, and the lending rates of multiple AAVE assets rose
There are some views that the "FTX incident" will cause users to lose confidence in CEX and turn to DeFi. But judging from the data, not only the liquidity of CEX was affected, but also DeFi failed to profit from it.
According to statistics from DuneAnalytics (@murathan / Uniswap V 3 Pool Analyzer), USDC-WETH (displayed as USDC-ETH trading pair on the Uniswapv 3 official website) is currently the most important trading pool in Uniswapv 3, accounting for about 46.21% of the trading volume. The lock-up volume of this pool was approximately US$123 million on November 19, a decrease of US$64 million or 34.24% from the short-term high of US$187 million created on November 7. Consistent with the liquidity changes of CEX, although the lock-up volume of the USDC-WETH trading pool has generally shown a downward trend since this year, the FTX incident has undoubtedly exacerbated this trend.
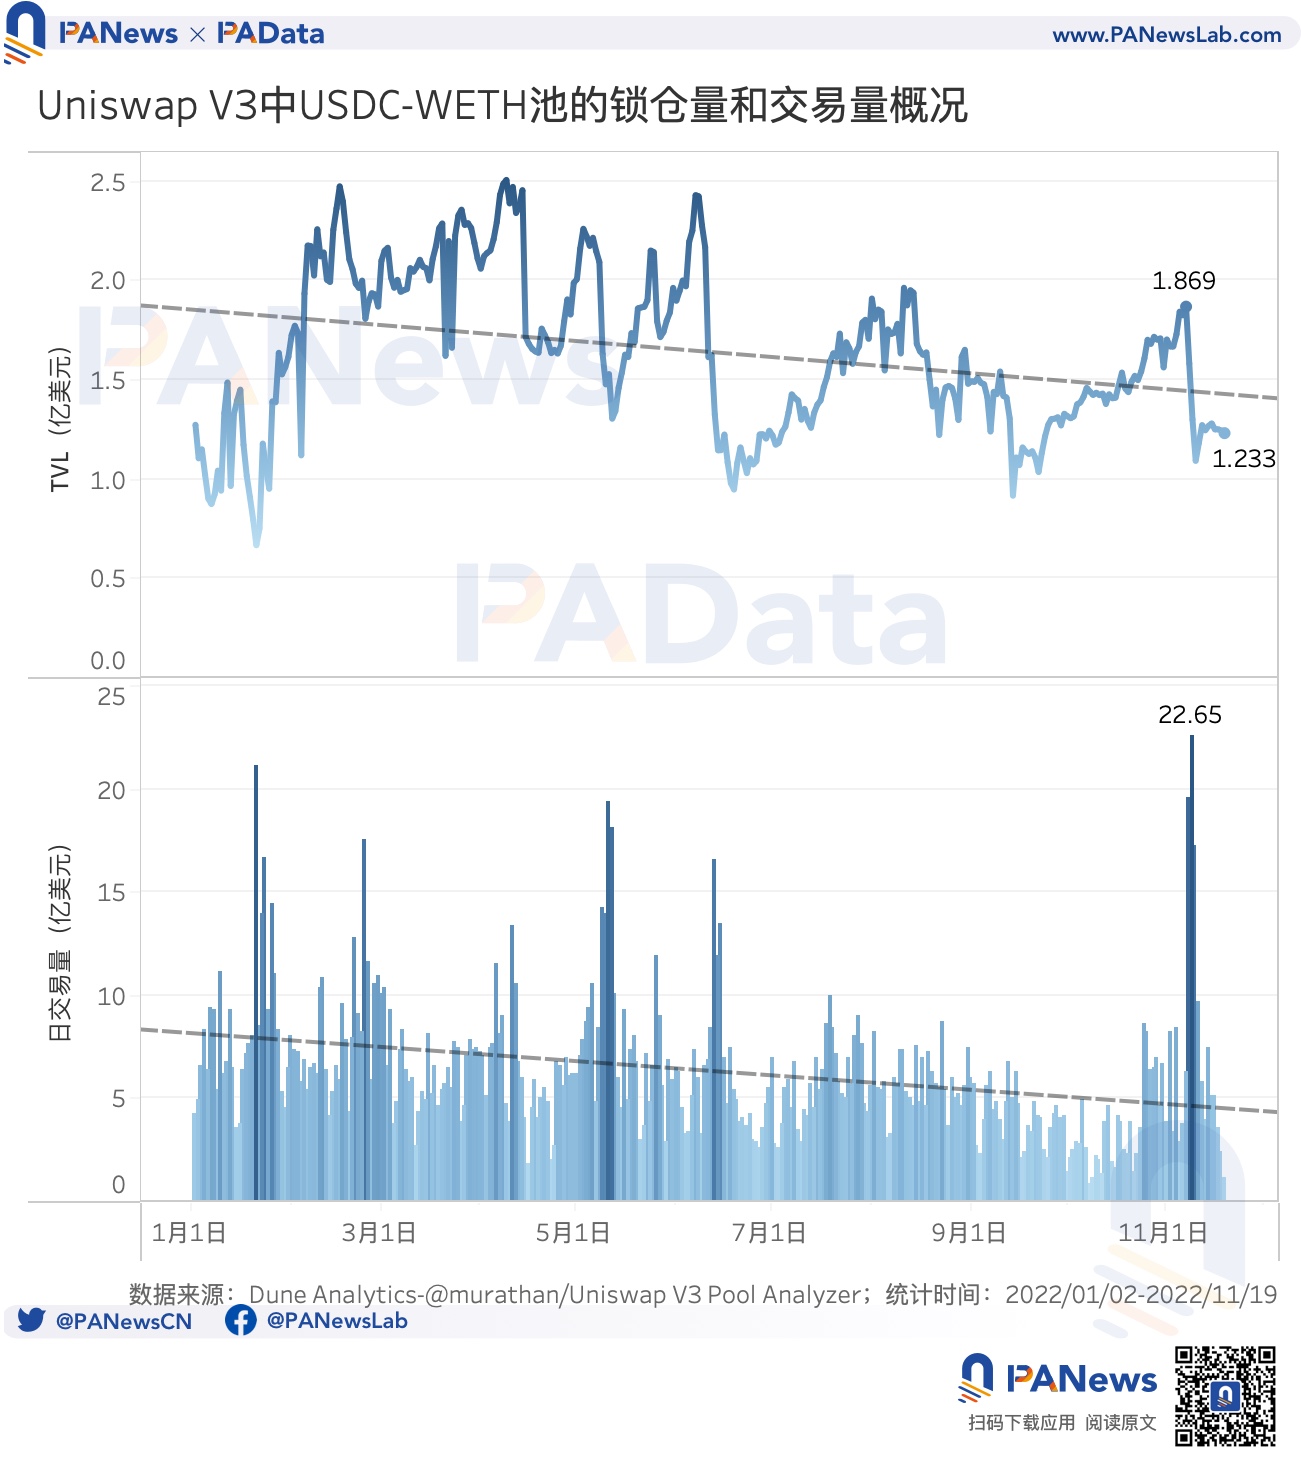
The transaction volume of USDC-WETH has also "shrunk". Except for the huge transaction volume of more than 1.7 billion US dollars in a row from November 8th to 10th, the recent daily transaction volume was below 800 million US dollars. On the 19th, none exceeded 250 million US dollars, only 246 million US dollars and 118 million US dollars respectively, which are extremely low levels this year.
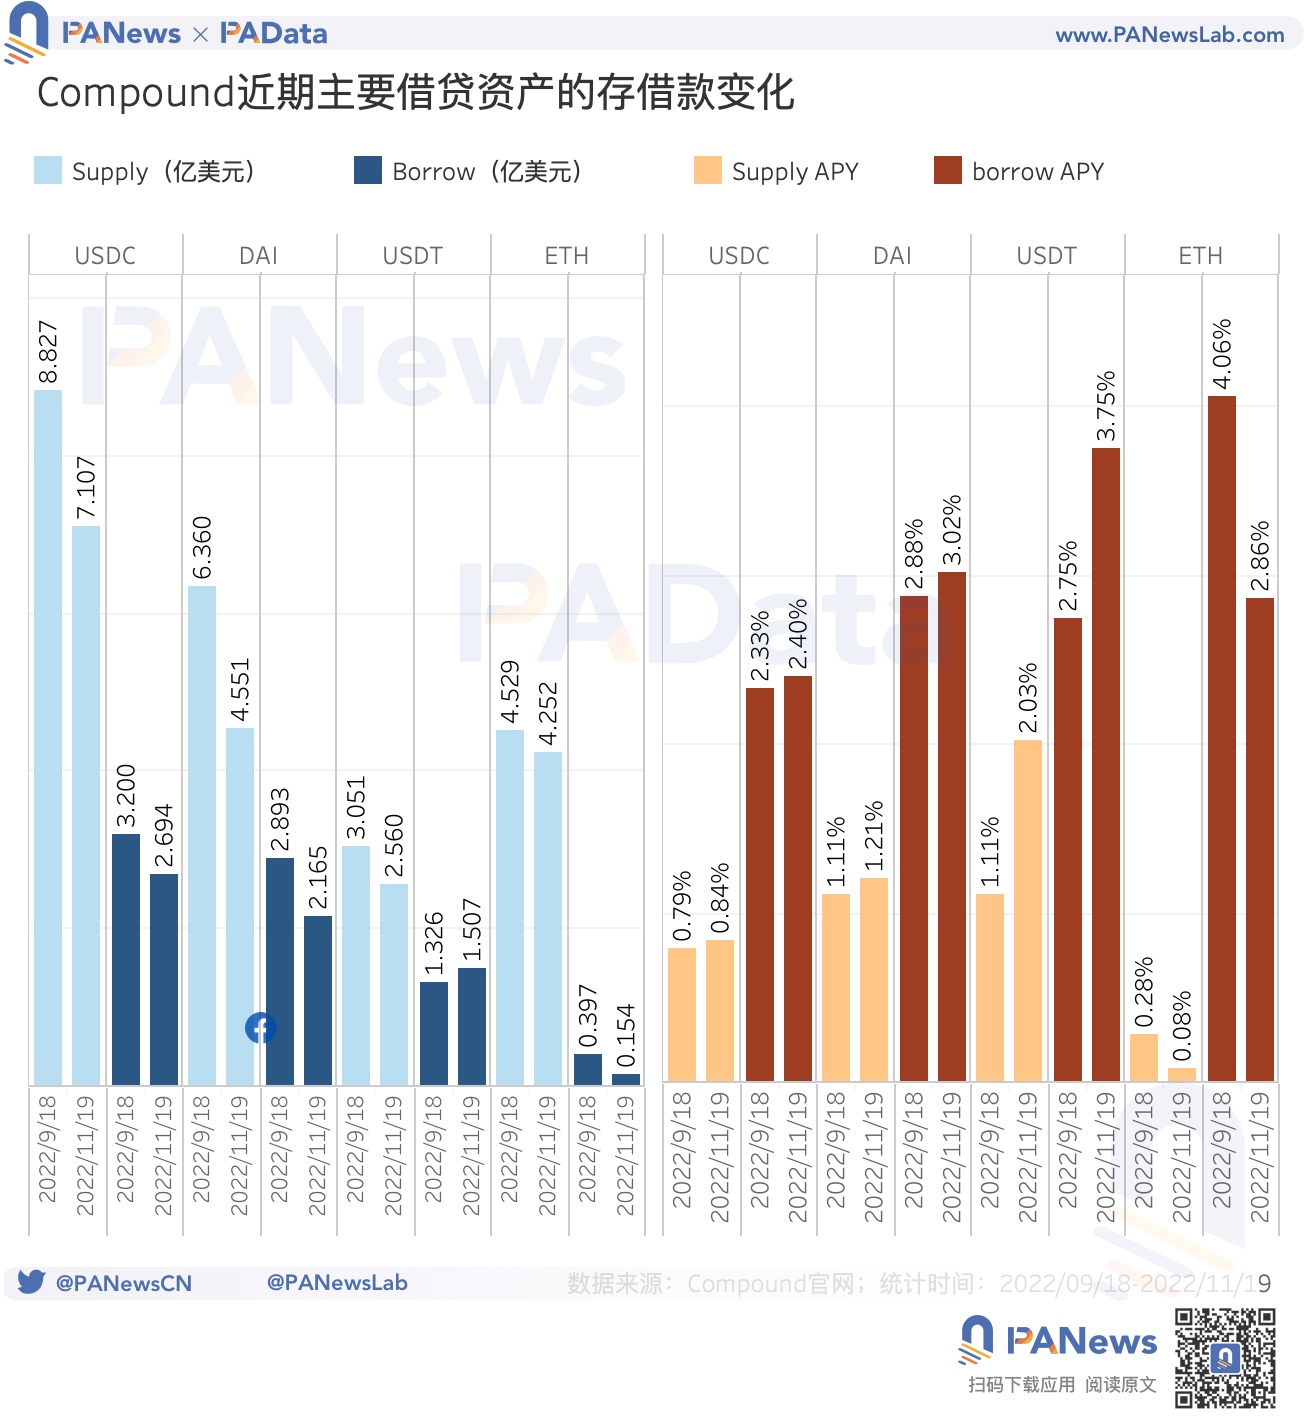
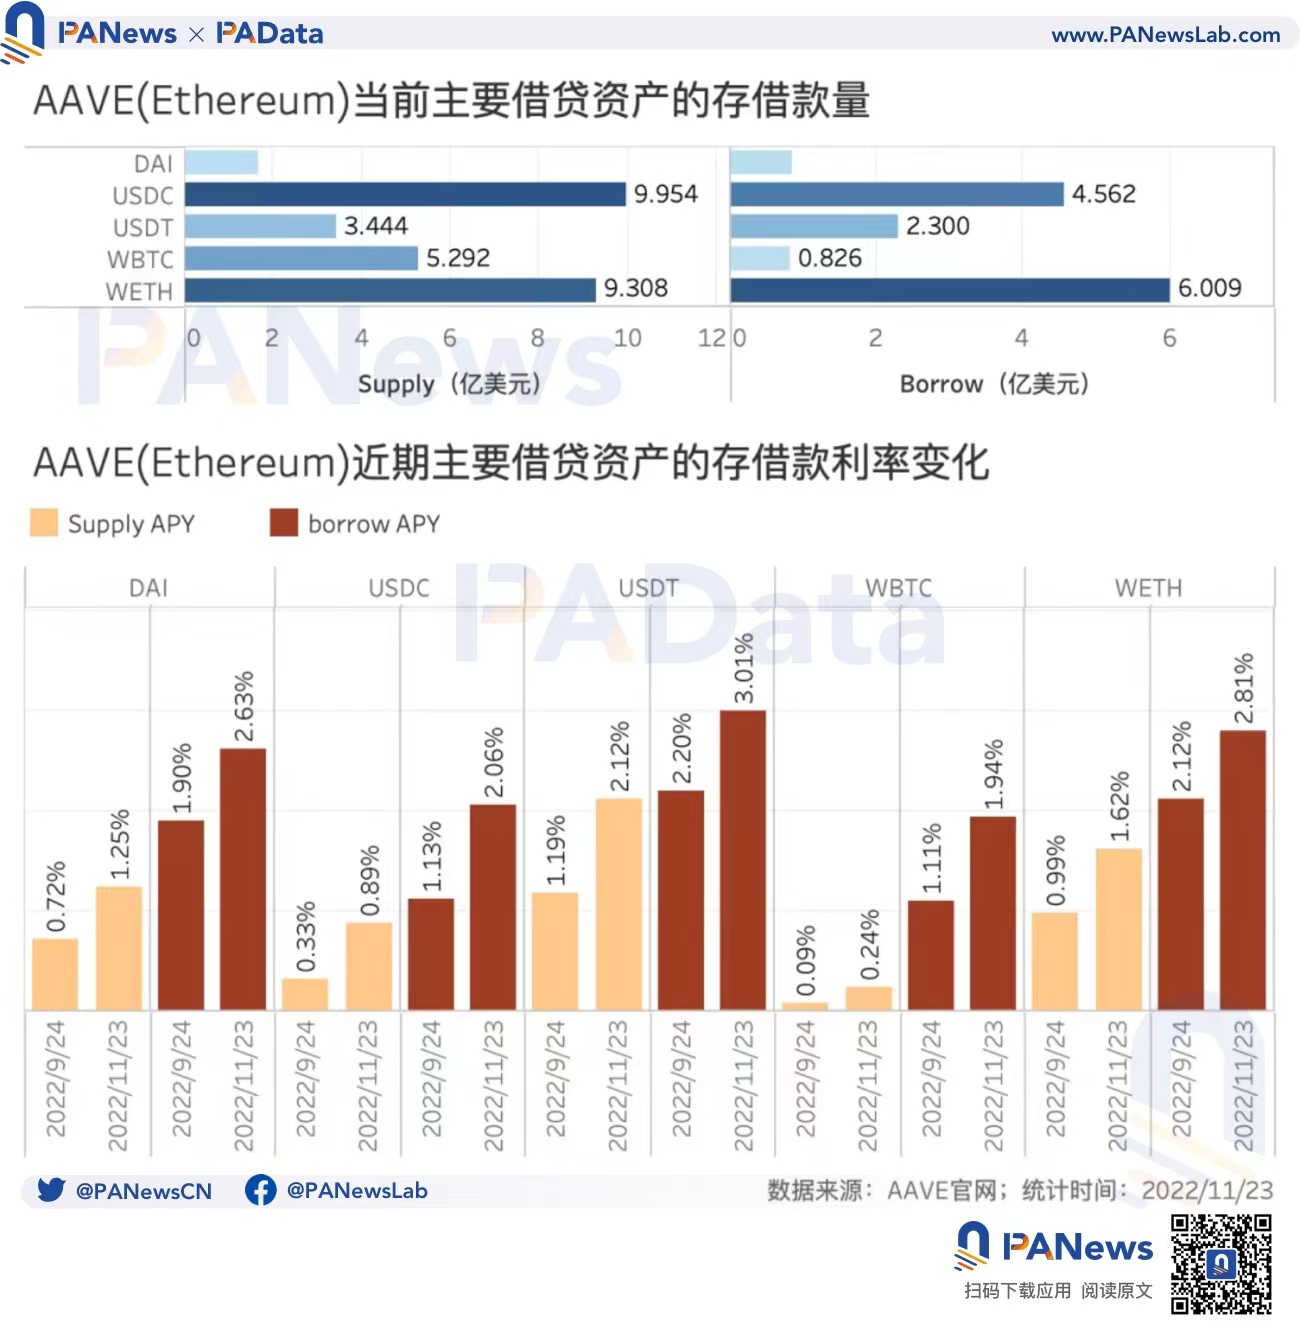
In addition to DEX, the liquidity of lending has also been affected. Almost all of AAVE and Compound’s major lending assets have experienced declining liquidity and rising interest rates in the last 2 months.
The deposit and borrowing rates of major lending assets on the largest lending market AAVE (Ethereum) have recently shown an upward trend. At present, the variable borrowing rate of USDT has exceeded 3%, and the variable borrowing rate of DAI and WETH has exceeded 2.6%. From the perspective of the relative change trend of deposit and borrowing rates, in the last two months, except for USDT, whose borrowing rate has risen less than that of deposit rates, the borrowing rates of other assets have increased more than deposit rates. Among them, the borrowing rates of WBTC and USDC have increased significantly increase in deposit interest rates. Changes in interest rates are closely related to changes in the scale of deposits and loans. A larger increase in borrowing rates means that changes in borrowing demand are greater than changes in deposits, which means that market liquidity is relatively insufficient.
In the past two months, USDC deposits in Compound have dropped from $883 million to $711 million, a drop of about 19.48%, while borrowings have also dropped from $320 million to $269 million, a drop of about 15.94%. Deposits fell more than borrowings, which also raised deposit rates by 0.05 percentage points, less than the 0.07 percentage points increase in lending rates. The situation is slightly different for USDT, whose deposit volume fell by 16.09%, but borrowing volume rose by 13.65%, which made USDT’s deposit rate increase by 0.92 percentage points, while the lending rate increased by 1 percentage point. The borrowing volume of ETH further shrank to 15 million US dollars, which was far lower than the borrowing volume, which caused the deposit and borrowing rates to fall further.