Original source: Echoo Research
first level title
image description
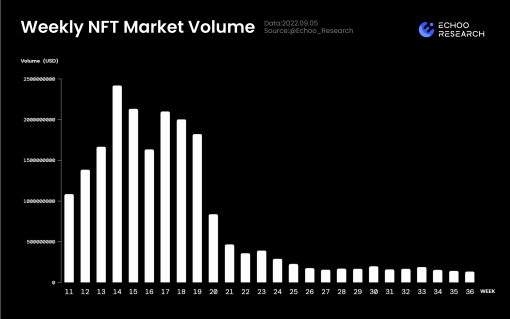
Weekly NFT Market Volume (Source: echoo.substack.com)
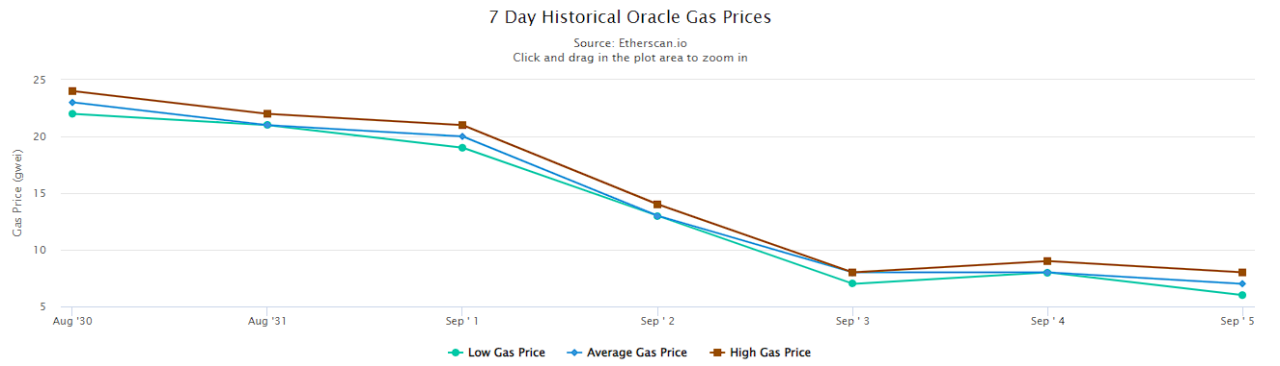
Oracle Gas Prices,(Source: etherscan.io)
The total trading volume of NFT this week has dropped by 6% again compared with last week. Although Gas Prices has reached the lowest range this year, it has not aroused people's desire to buy or sell. Current status: The trading volume of the NFT market is still sluggish, and there is no sign of a strong rebound.
image description
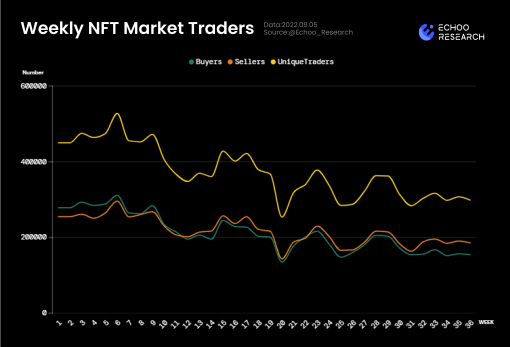
Weekly NFT Market Traders (Source: echoo.substack.com)
image description

Blue Chip Index (Source: echoo.substack.com)
After falling for 5 consecutive weeks, the blue-chip NFT index has been temporarily "supported" near the lowest value of this year. At the same time, the "rebound is weak and there is a trend of flattening" we mentioned last week. It has been verified this week .
image description
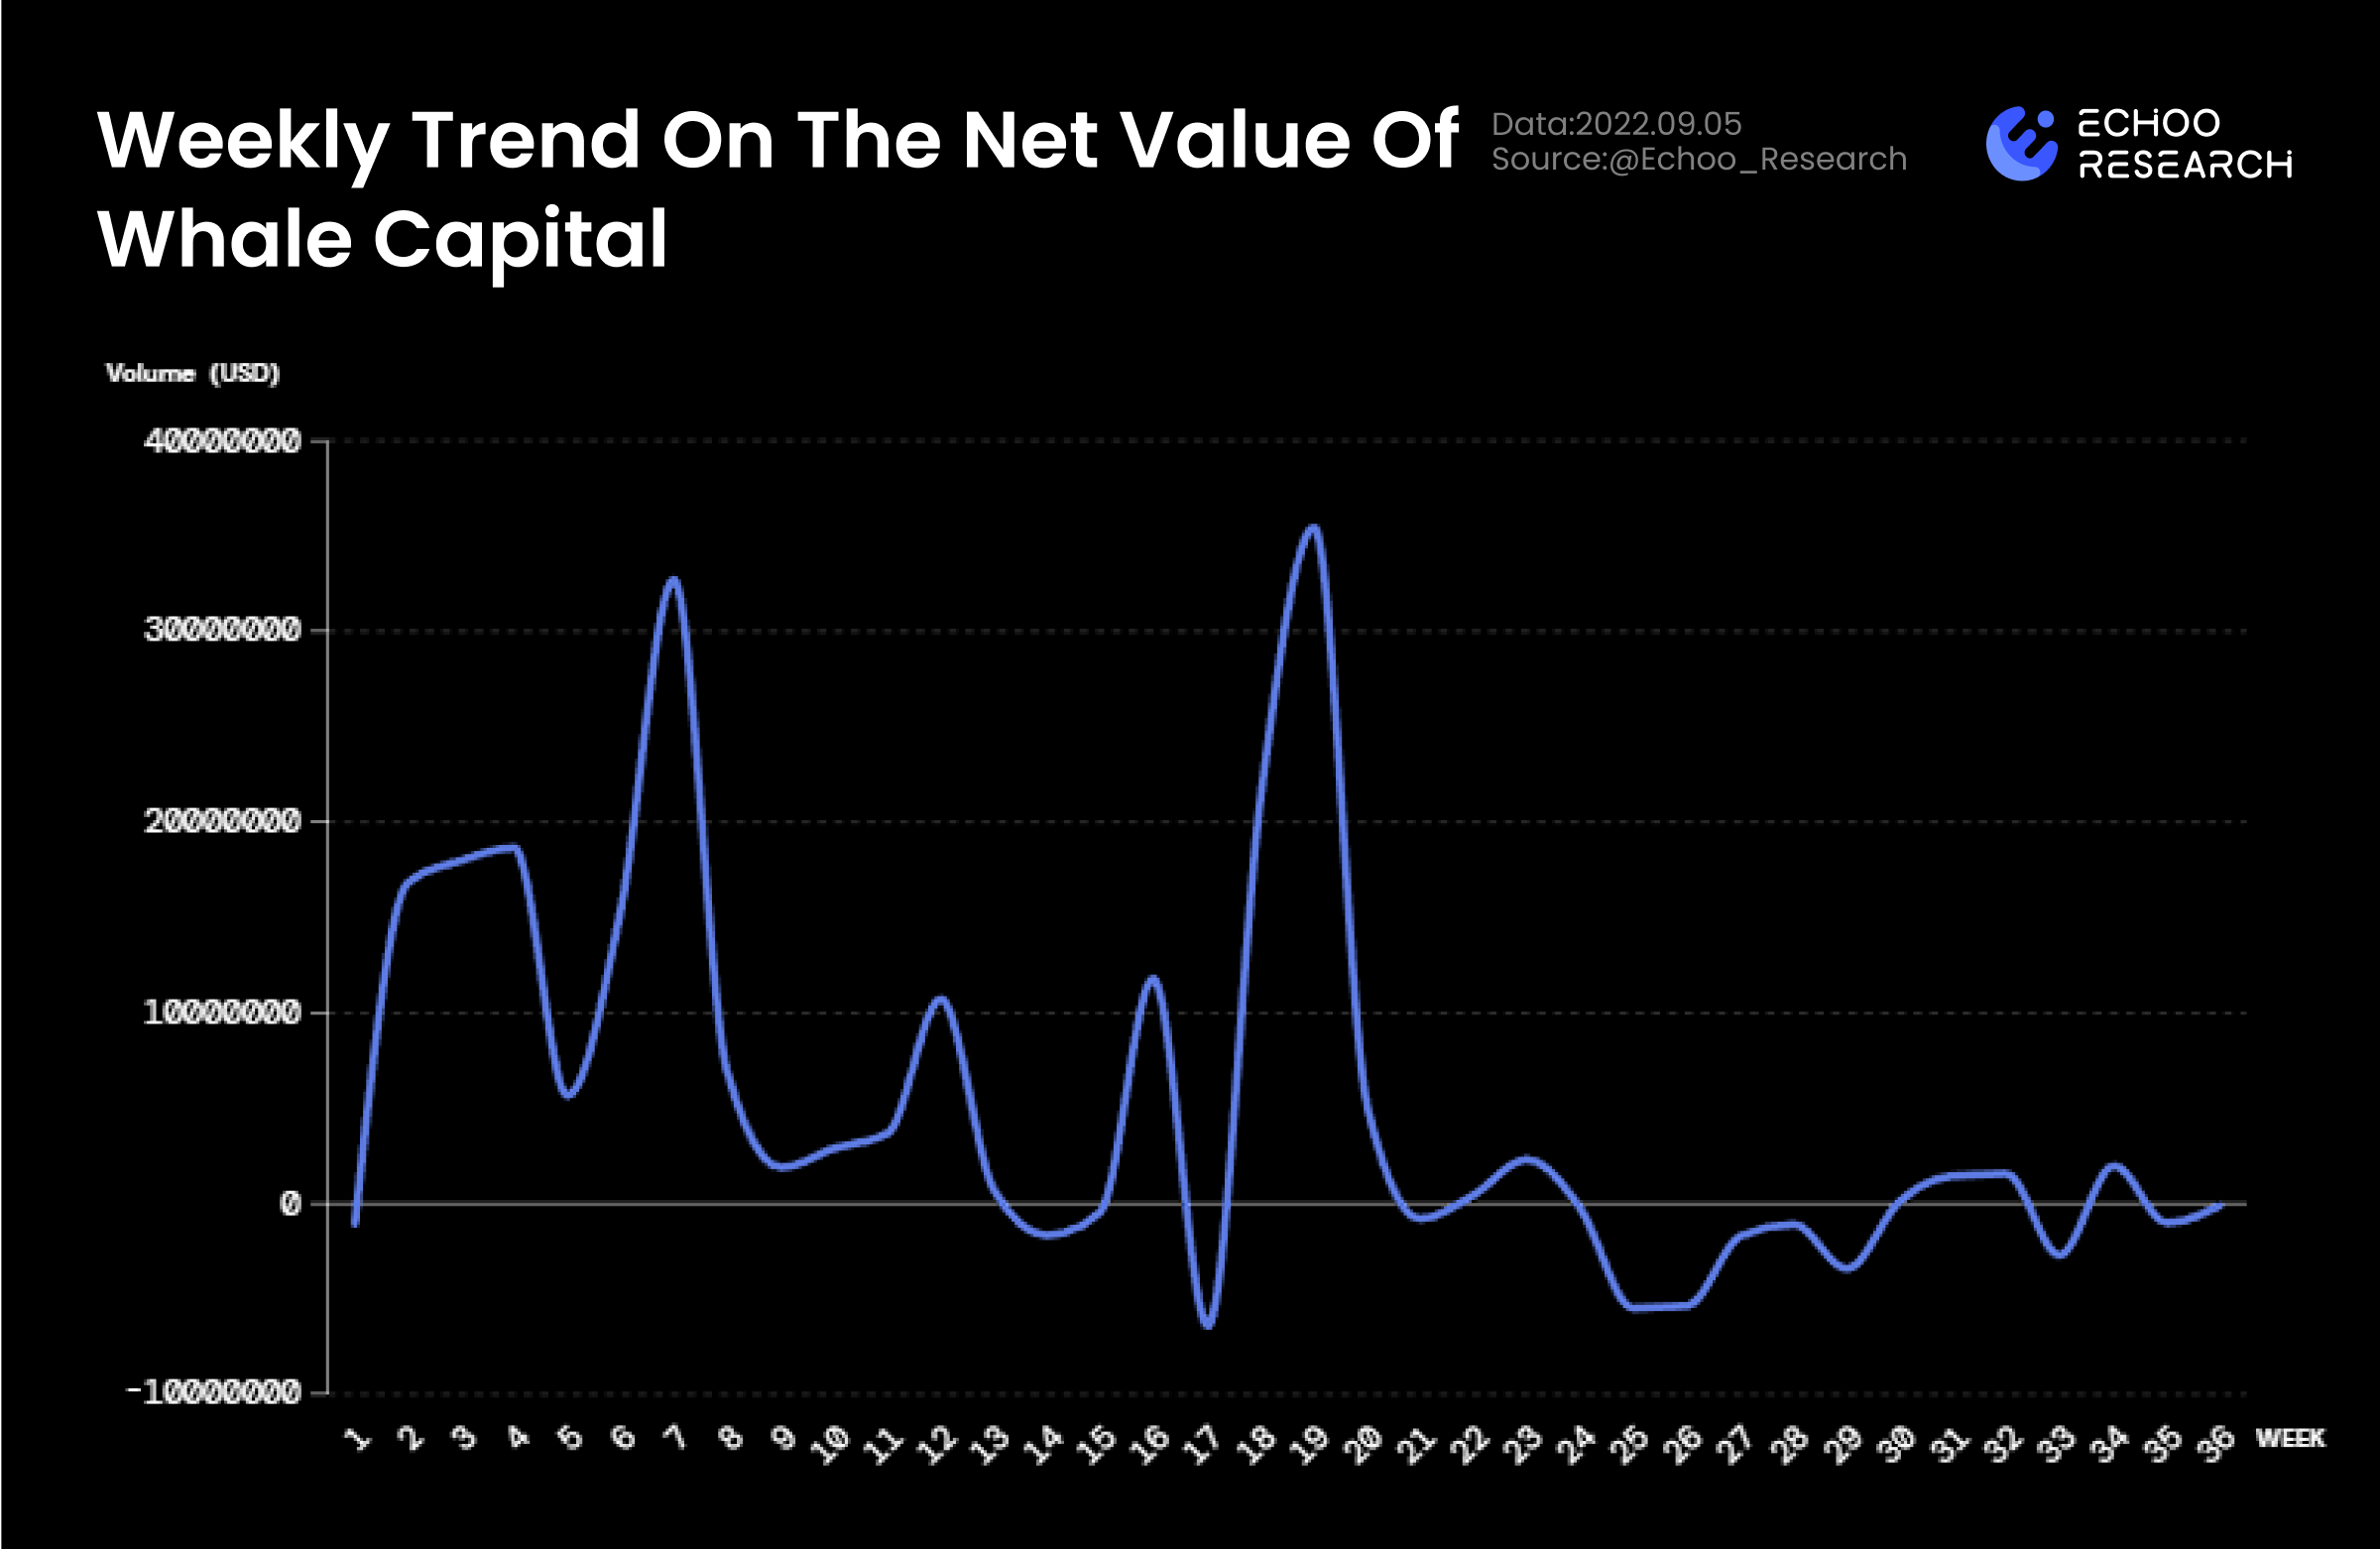
Weekly Trend On The Net Value Of Whale Capital (Source: echoo.substack.com)
first level title
secondary title
1. The NFT that the giant whale bought at the bottom last week
The following table shows the top 20 NFTs purchased by giant whales. The detailed purchase quantity and average cost are as follows:
secondary title
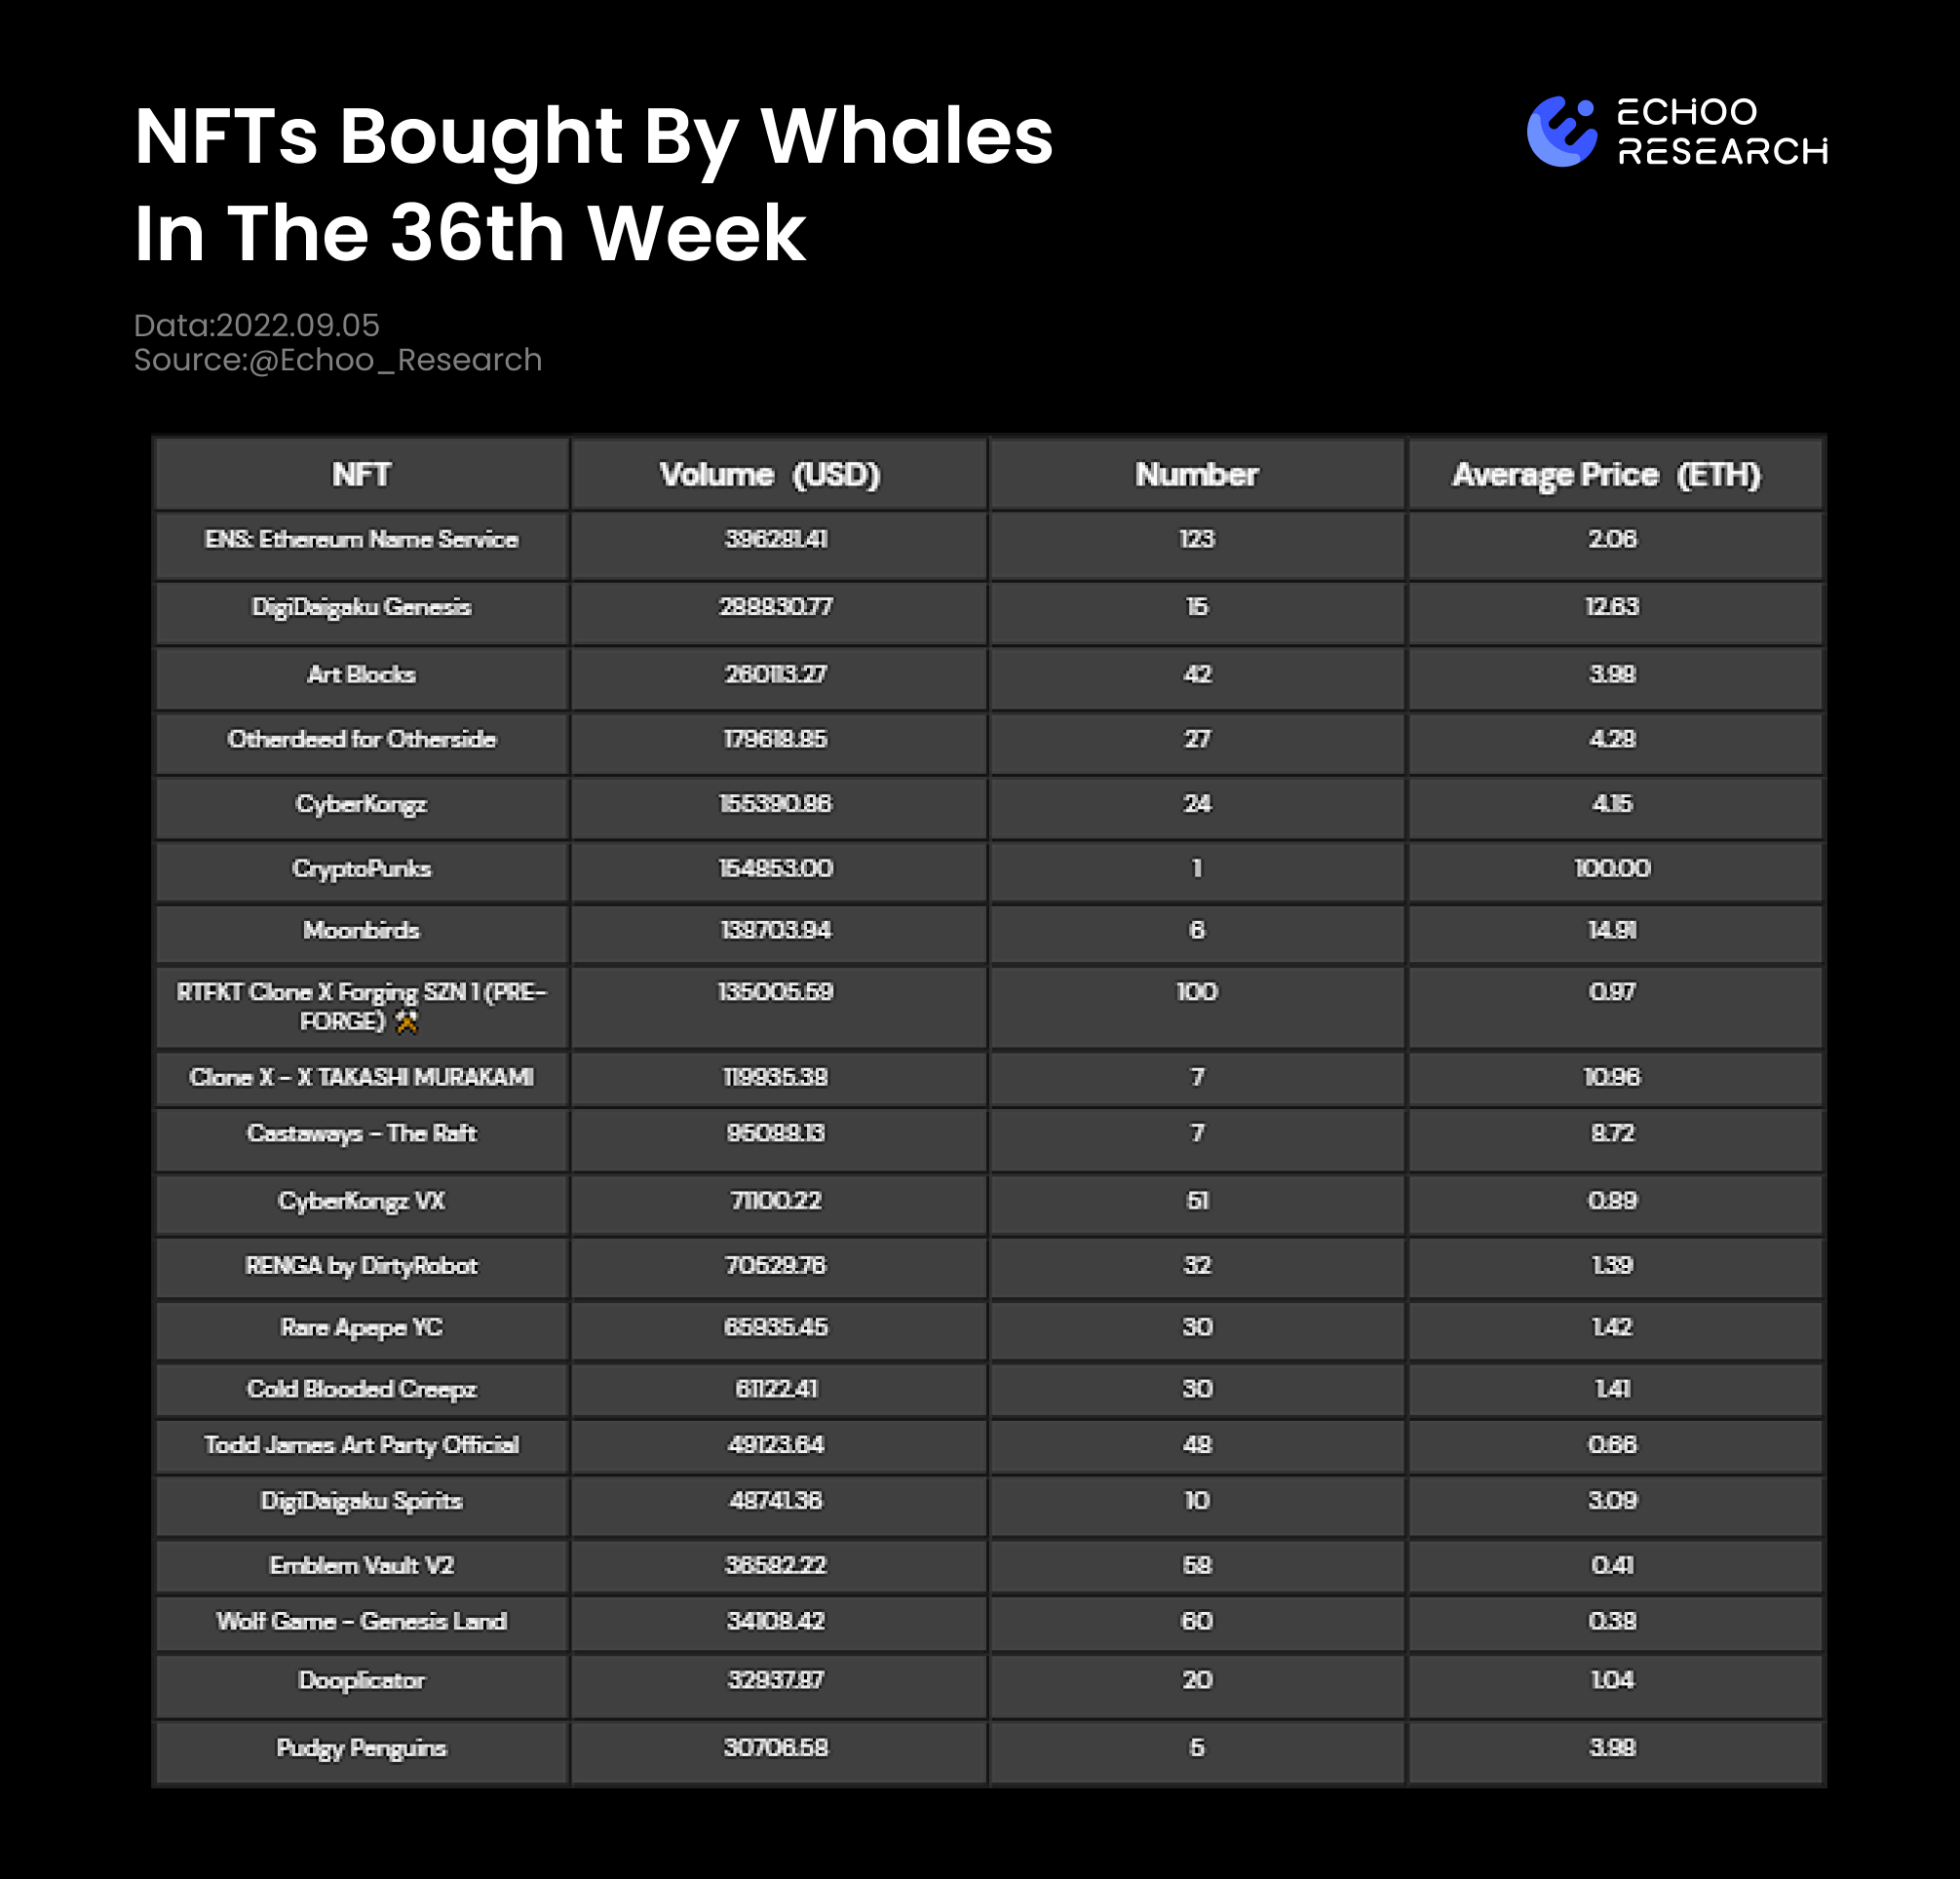
NFTs Bought By Whales In The 36th Week
2. Blue chip NFT buy and sell signals
The indicators provided by Echoo Research in this issue are blue-chip NFT buying and selling signals, which have certain reference for buying and selling behaviors.
image description
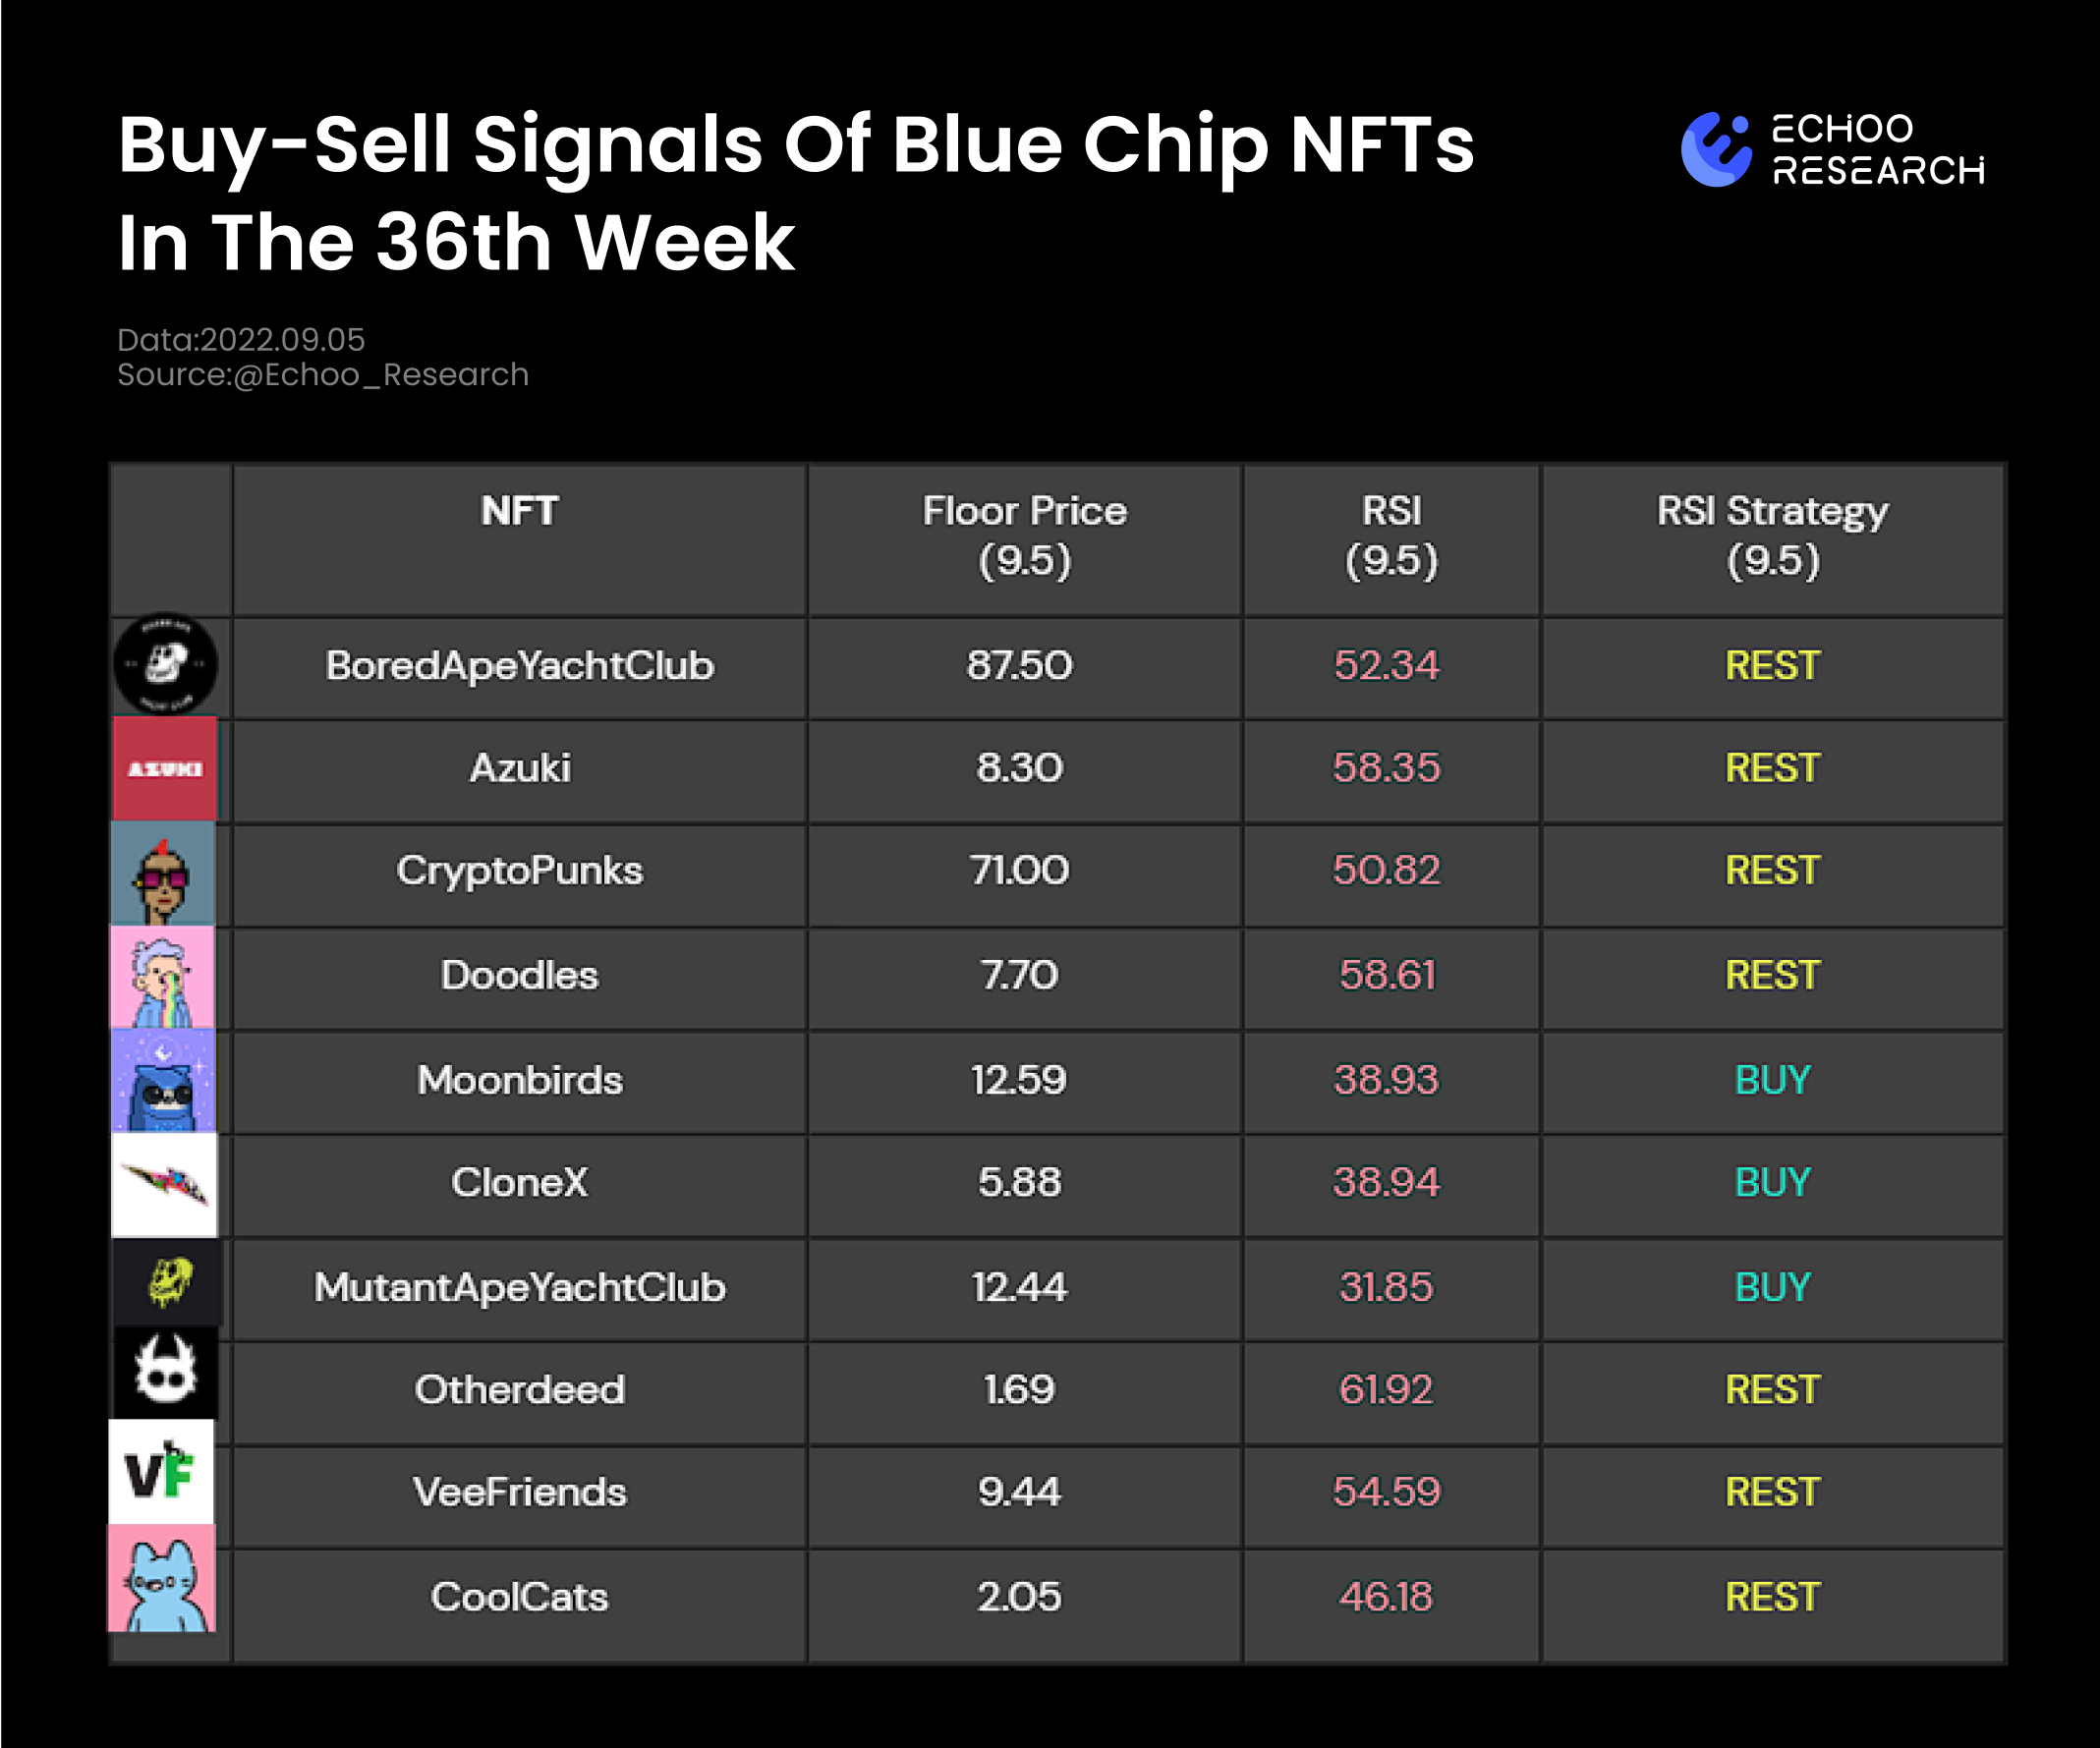
Buy-Sell Signals Of Blue Chip NFTs In The 36th Week
Indicator description
RSI Strategy:A buying and selling signal designed based on the relative strength of buying and selling of RSI.
Simple method of use:secondary title
3. SMA trend of blue chip collection
image description
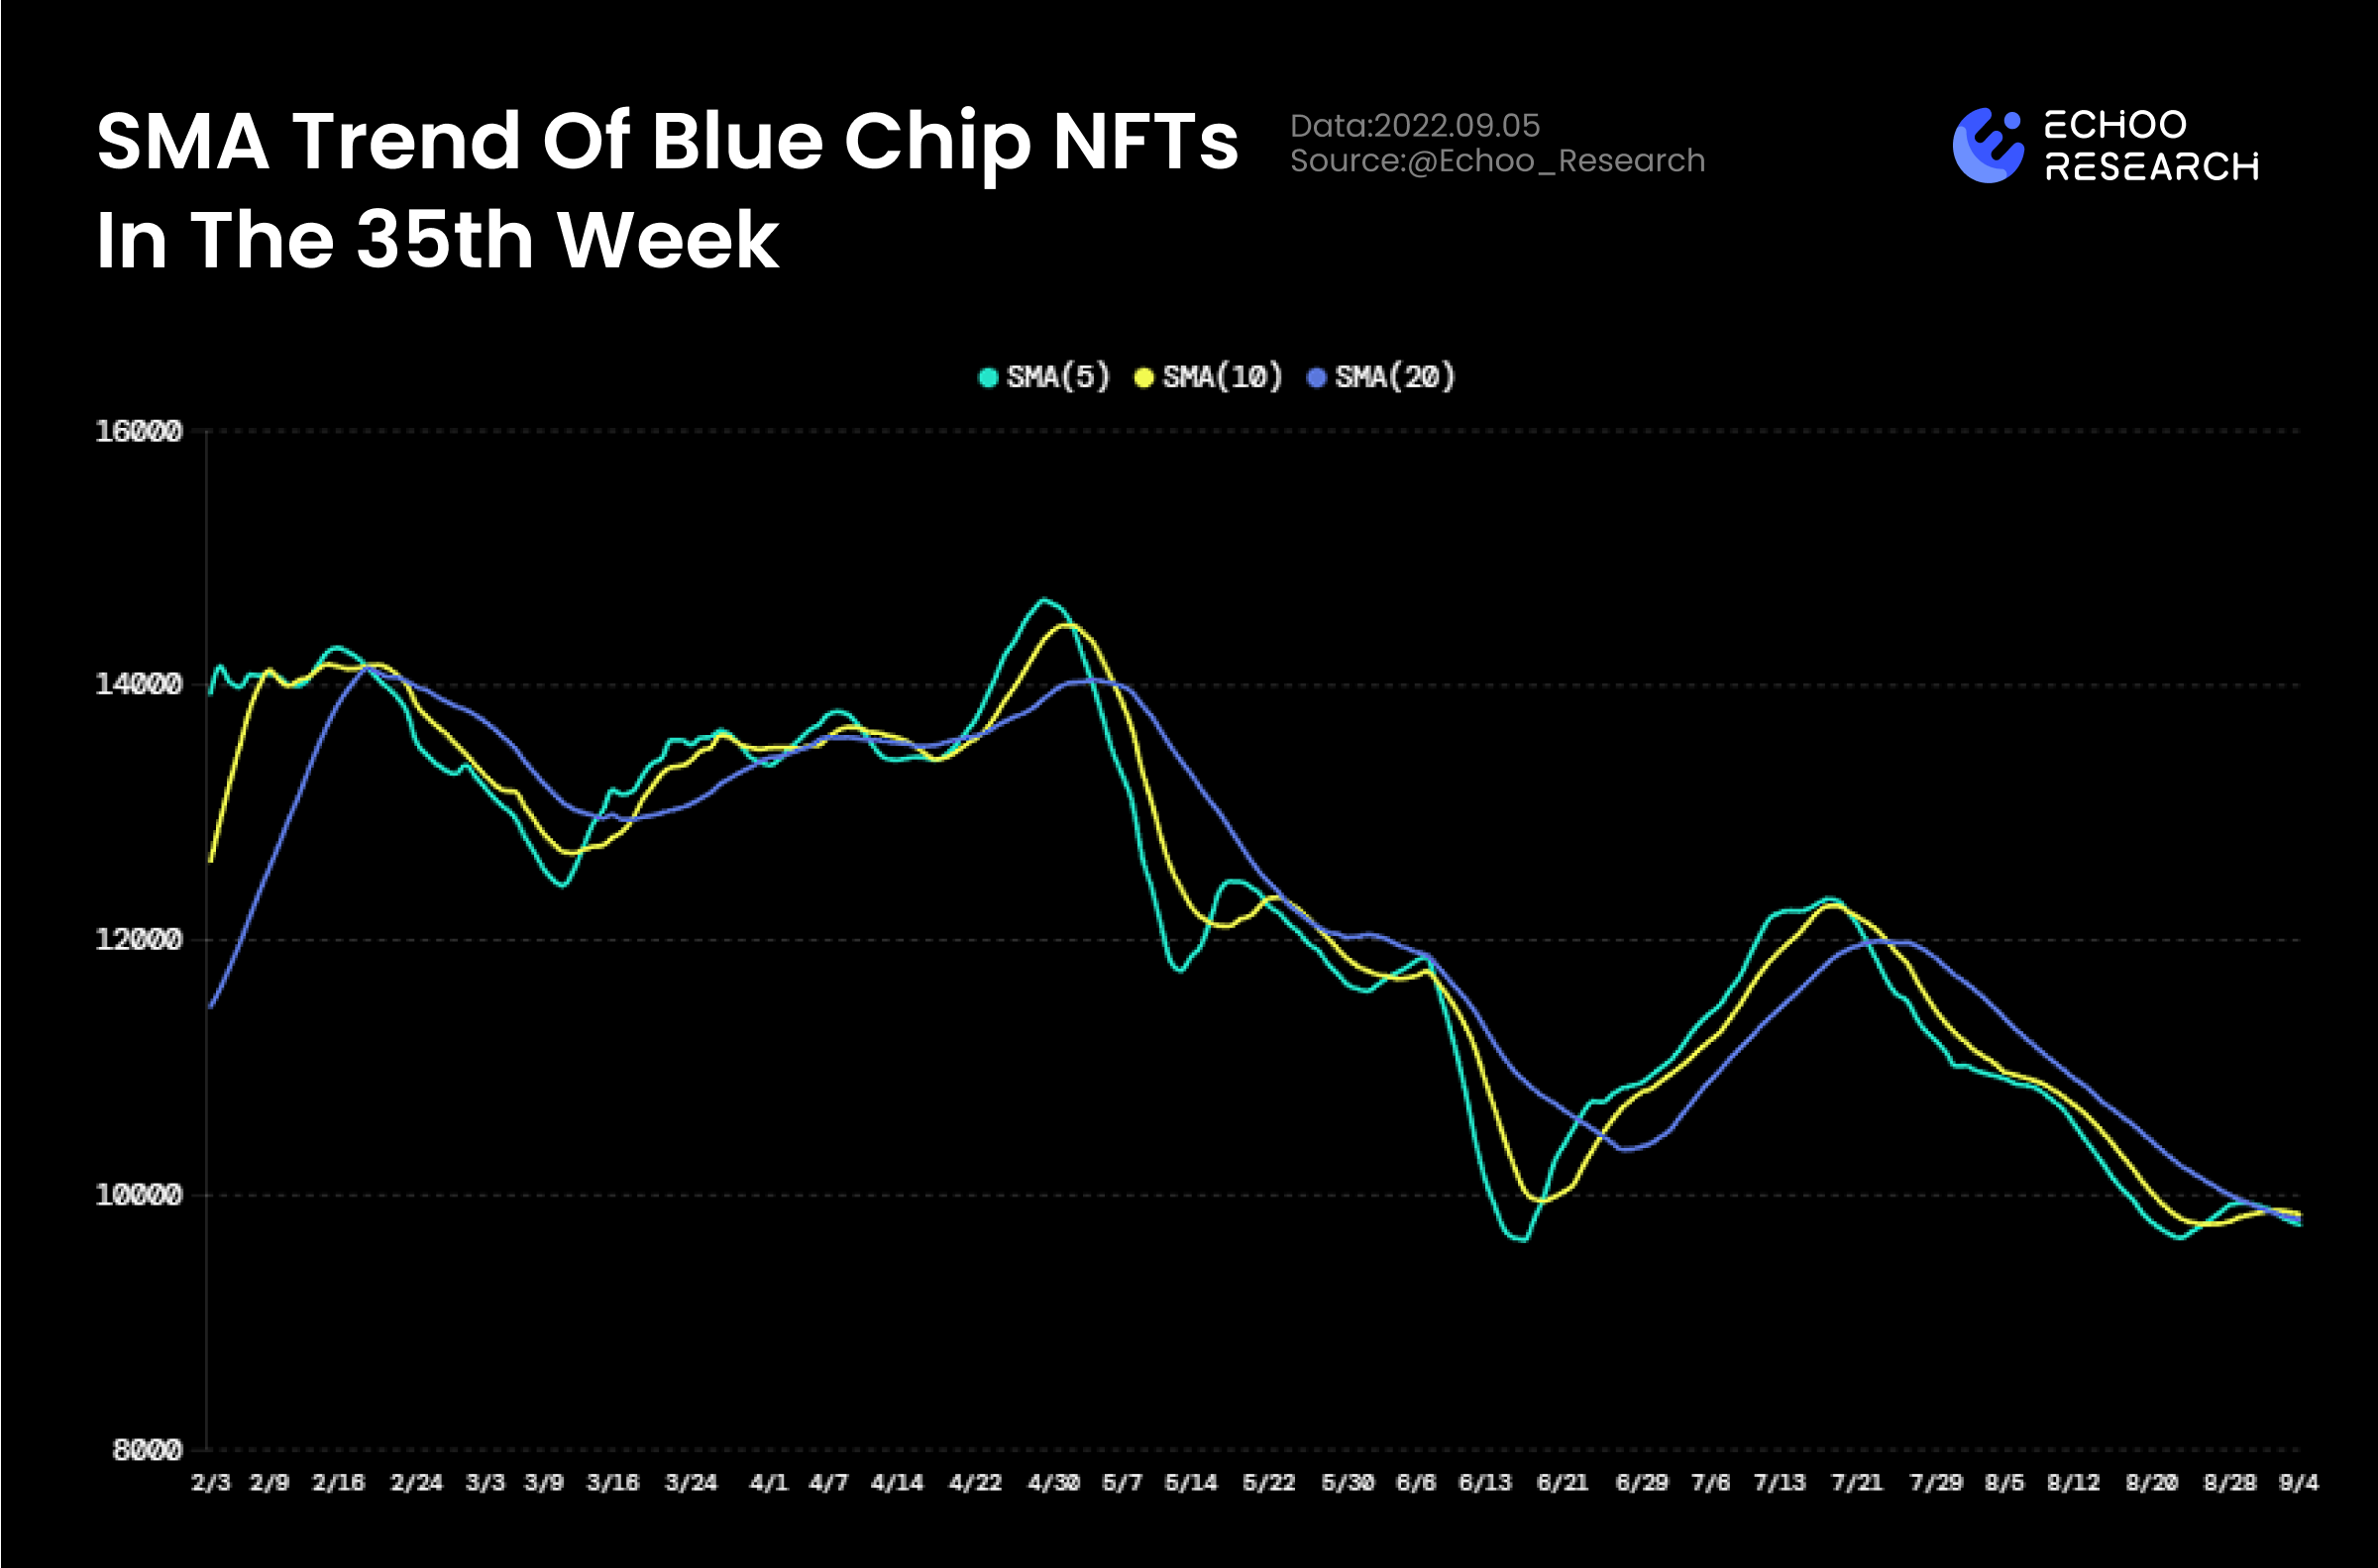
SMA Trend Of Blue Chip NFTs In The 36th Week
Indicator description
This indicator synthesizes the market value of blue-chip NFTs and calculates them using moving averages to reflect the trend of the NFT market.
SMA: Reflects the trend of short-term to long-term.
Simple usage: When the short-period line crosses the long-period line from below, it is a buy signal, and when the short-period line crosses the long-period line from above, it is a sell signal.
……