This article is from Nansen, republished with authorization by Odaily.
first level title
TLDR
Common token (fungible token) cycle: Nansen analyzed investor sentiment and macroeconomic indicators, summarized as follows:
Investor sentiment turns to “panic” in May 2022, marking the beginning of a long period of consolidation in cryptocurrency prices (see Figure 1)
In order for cryptocurrency prices to exit the consolidation phase and bottom out, fundamental uncertainty must decrease
The main case for this scenario is that the Fed is more focused on unemployment than inflation.
Real growth is slowing sharply, which means that is getting closer.
Historical analysis suggests a higher likelihood of the Fed pausing monetary tightening until Q1 2023 (see Figure 6)
NFT (Fungible Token) Cycle: NFTs have a weaker correlation with common tokens than between common tokens. Nansen developed an investor sentiment indicator specific to the NFT market based on two on-chain indicators:
Realized volatility tracking NFT prices: higher realized volatility -> higher forward weekly returns
summary
summary
Our recent analysis of the crypto asset market revealed four insights:
1) Investor sentiment turned to extreme panic in May, which translated into accelerated allocations to stablecoins, especially USDC, and investments in various digital (and non-digital) “safe havens”. In our opinion, this has resulted in a correction in the price of common tokens, which the market needs more time to digest.
2) The current macroeconomic cycle is transitioning from stagflation, i.e. slowing real growth and rising inflation, leading to a sharp deterioration in real growth and high inflation. The weaker real growth is, the more likely it is that the Fed will delay tightening policy with further rate hikes (“Fed puts”). When this probability reaches a sufficient threshold, it may support the cryptocurrency market.
3) Based on the macro indicators reviewed in our paper, we are close to (estimated Q4 2022 - Q1 2023) but not quite in the support phase.
4) The pause in this favorable monetary tightening is likely to be shorter than in past cycles, as we believe global geopolitical factors, the disintegration of global supply chains, and retired "baby boomers" (the wealthiest in terms of asset ownership) Inflation is likely to re-accelerate after a recession, fueled by years of spending spending over the next generation.
Extending our analysis to the NFT (non-fungible token) market, our analysis shows that the following indicators tend to drive NFT prices: 1) the tracking price fluctuations of NFTs and 2) the trading volume of more mature NFT collections and The ratio of all transaction volumes.first level title
secondary title
1.1 Risk preference indicators for stablecoins
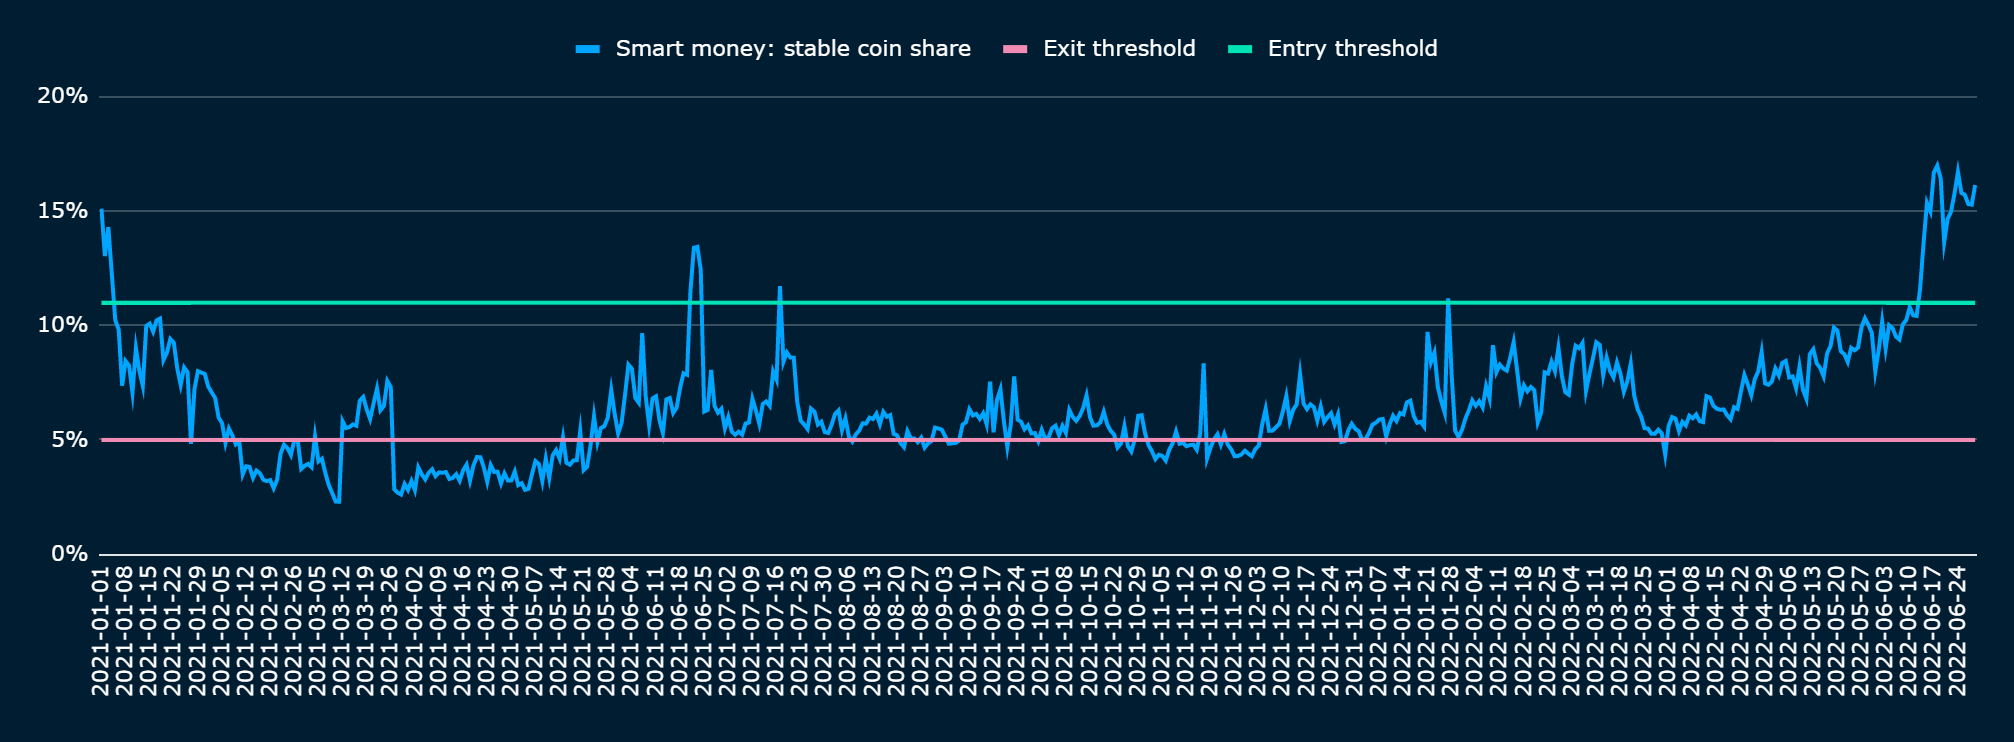
The Nansen Stablecoin Risk Appetite Indicator gauges crypto investor sentiment by measuring the relative allocation of stablecoins to the total USD balance of “smart money” wallets (see Figure 1). In May 2022, the rate spiked to around 16% at the time of writing, above our 11% "panic threshold" (more details atsee this article)。
In the respective decoupling events of UST and sETH (see Nansen onUST Decoupling Event Report) and the unraveling of leveraged investment schemes across liquidity pools and other DeFi protocols, sentiment and prices have understandably deteriorated. According to the stablecoin risk appetite indicator, as the price of the cryptocurrency adjusts, investors areexacerbated concernsimage description
secondary title
Source: Nansen Query
1.2 Shift to rapidly deteriorating real growth and high inflation
Sentiment alone is not enough to call for a contrarian “bottom” in crypto asset prices. Sentiment is likely to remain subdued as long as the fundamental drivers behind asset prices remain negative. This is the difference between an investor's perception of risk and the actual underlying fundamental uncertainty (see Section 3.1 for details).
Historically, a high-inflation and volatile macro environment has been bad for risky assets (and cryptoassets are no exception) as it forces discount rates higher even as real demand deteriorates (lower top line).
image description
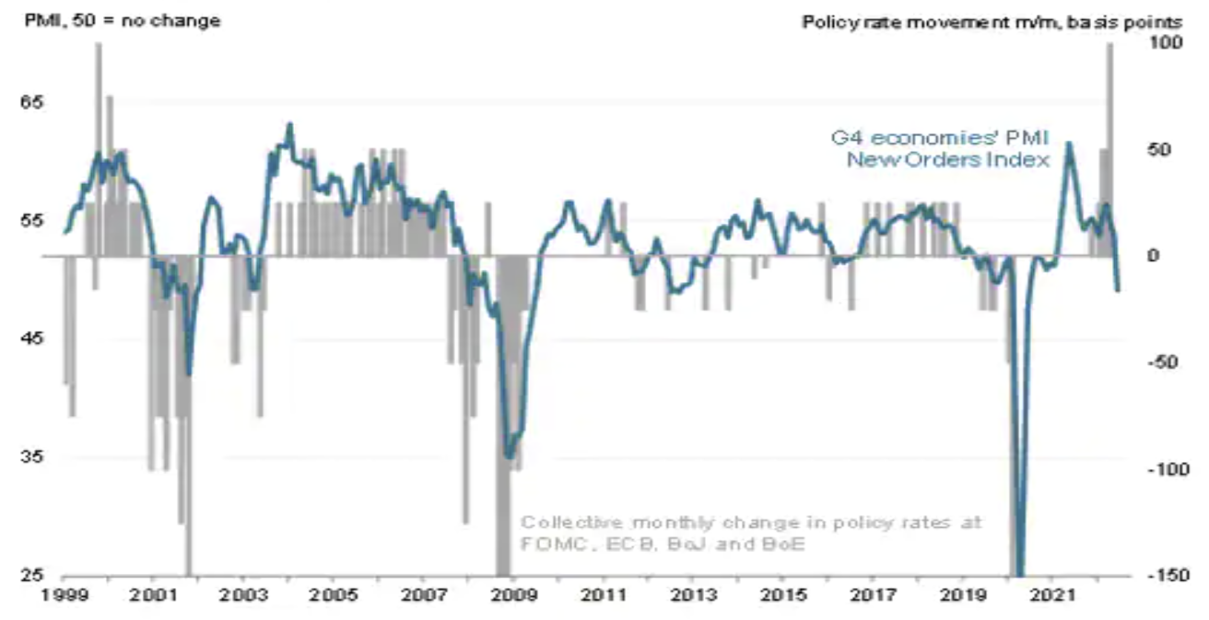
image description
Source: Markit, S&PGlobal
image description
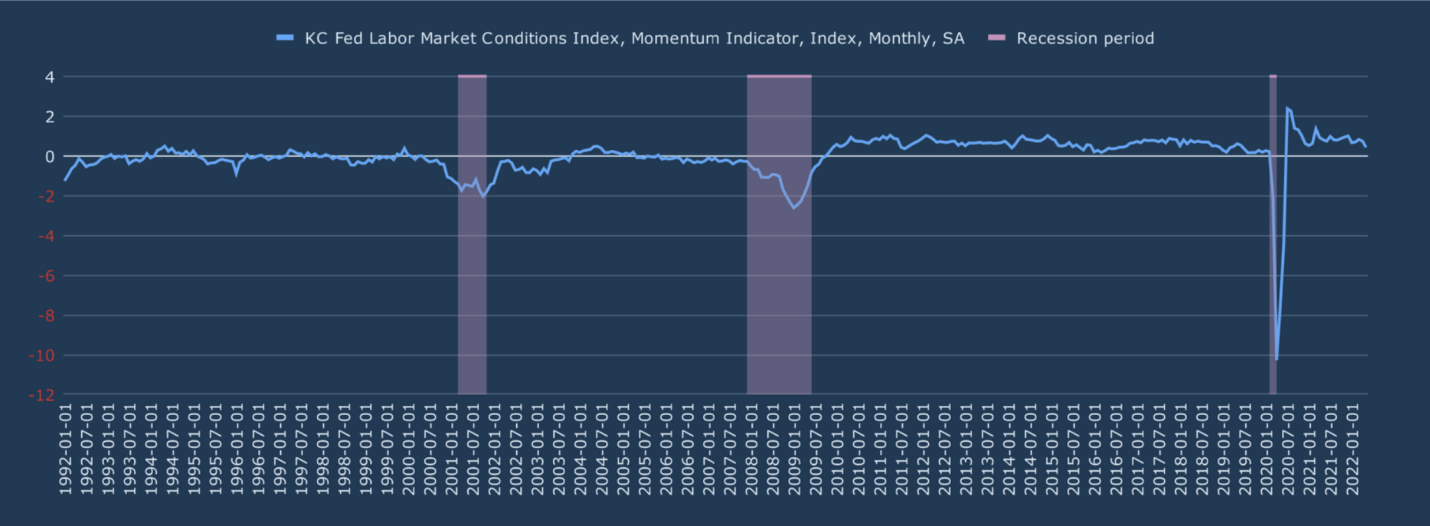
image description
Source: St-Louis Fed and Kansas City Fed
secondary title
1.3 Waiting for the "Fed Put"
image description
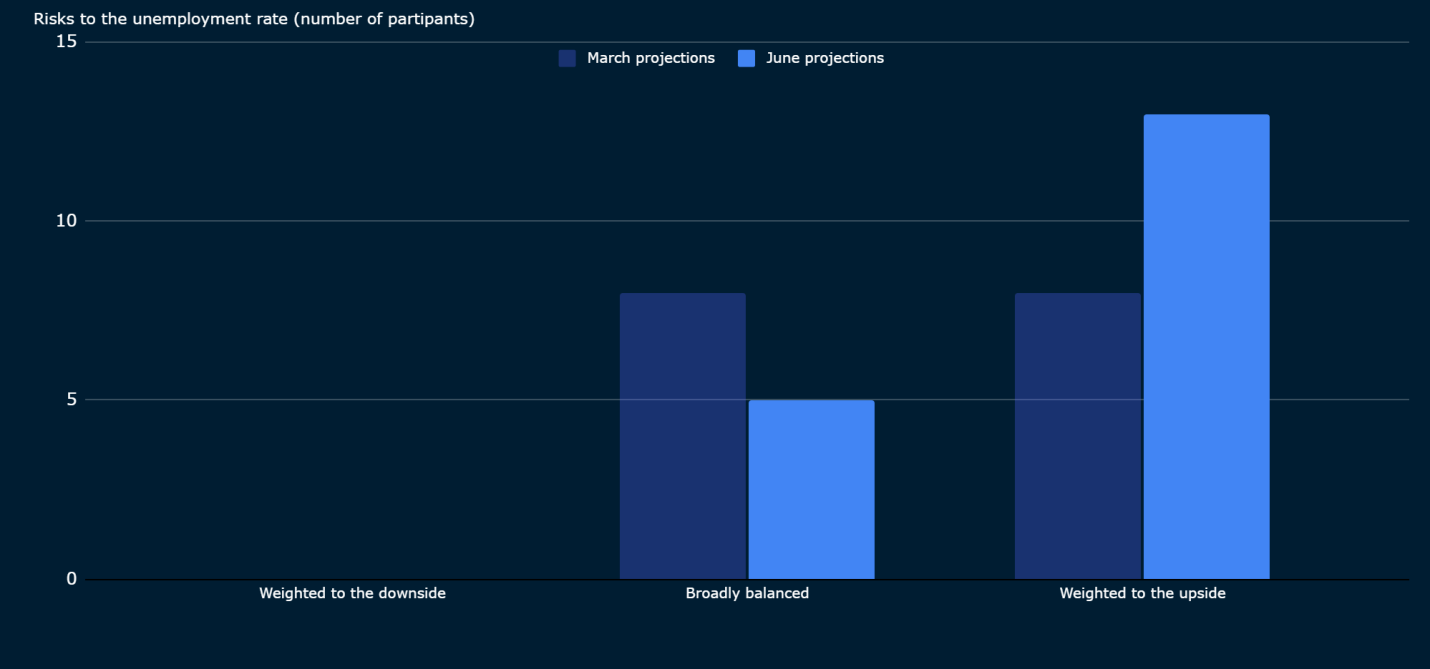
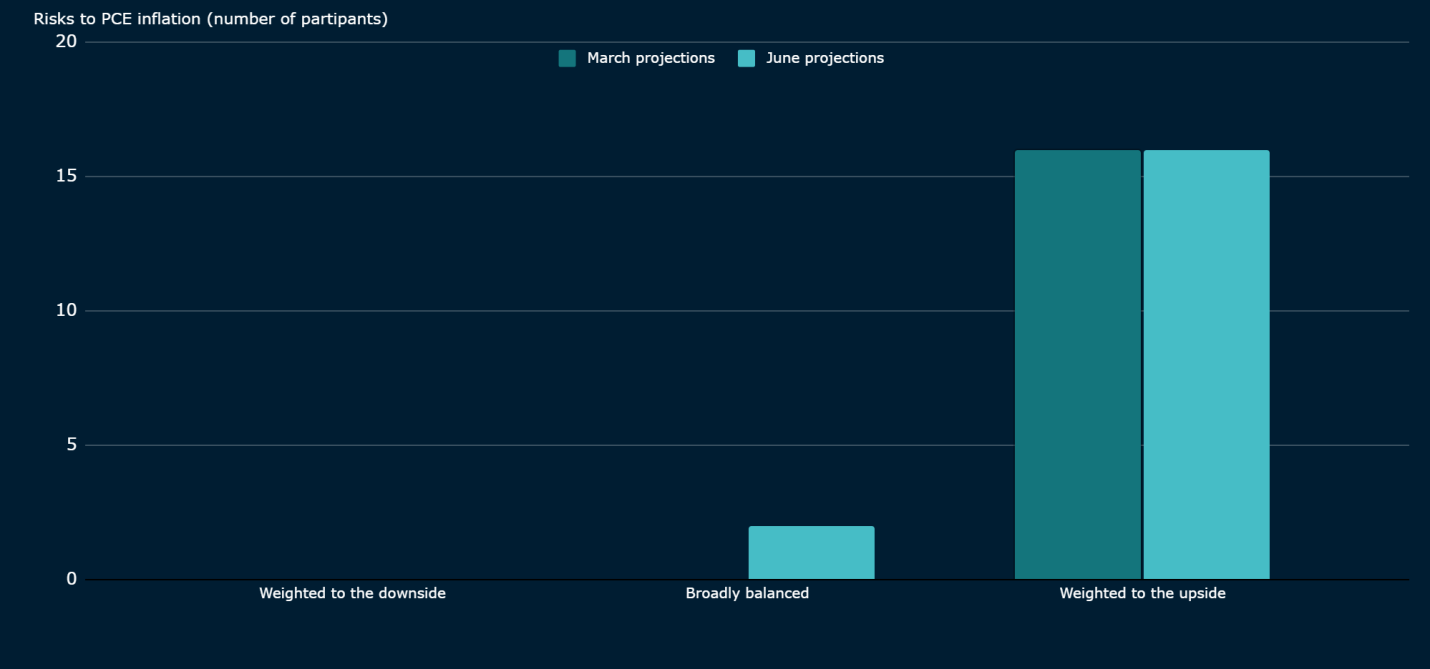
image description
Source: Fed economic projections June 2022
We tried to use the most reliable recession predictor, the US Treasury yield curve, to measure the time horizon estimates for Fed activation (see Figure 5). Based on our historical analysis, the lead time between yield curve inversion (we use US 10-year to 2-year maturities here) and first policy rate cut is about 7 months (on average). This would translate into a greater likelihood of rate cuts or, more likely, a pause in monetary tightening until 1Q2023, followed by a recession by 3Q2023 (16 months lead on average). We note that lead times are spread widely, with the maximum or latest date of the Fed pause estimated to be in 1Q 2024 (22 months). The risk assets most sensitive to interest rates, such as crypto assets, may pre-empt the "Fed put option".
image description
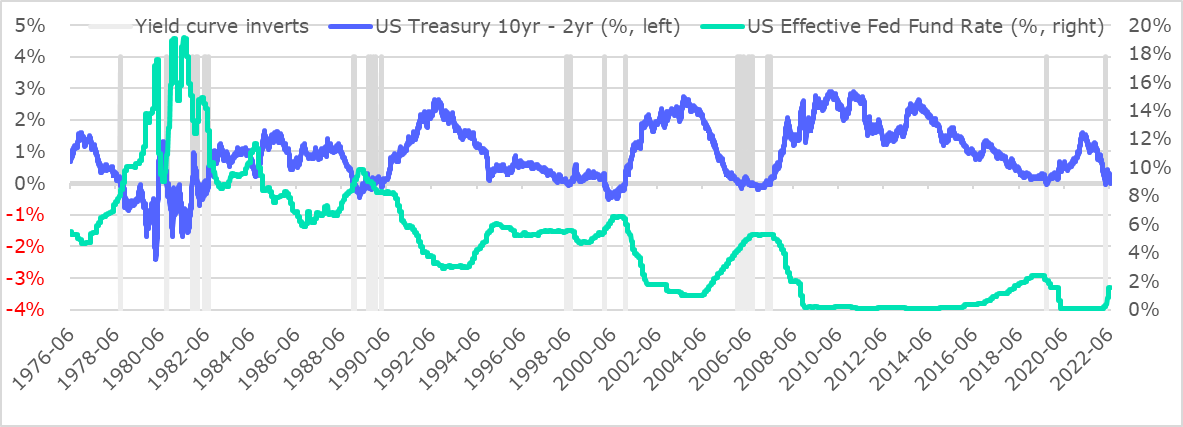
image description
image description
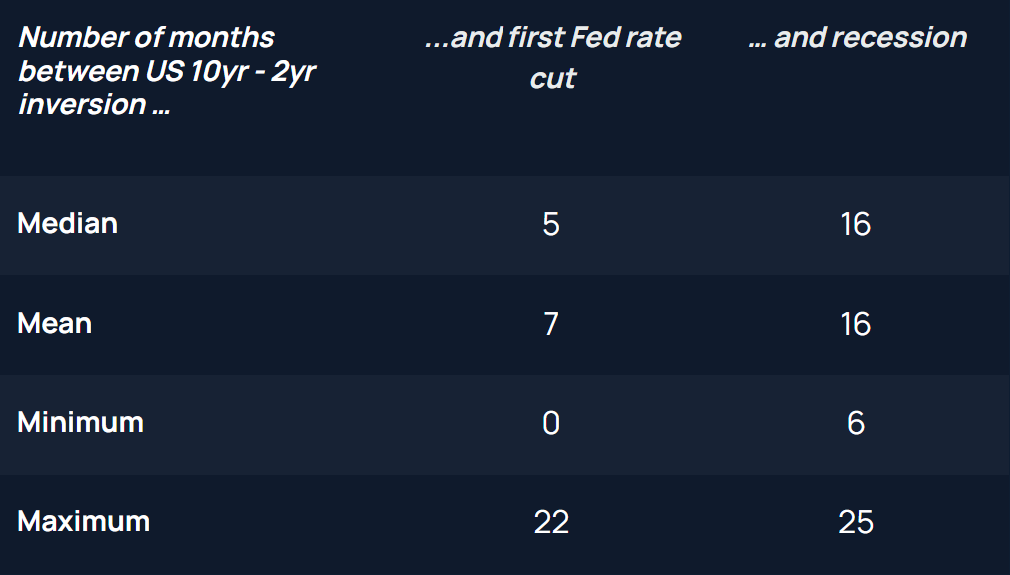
image description
secondary title
1.4 Crypto Market Cycle Indicators
image description
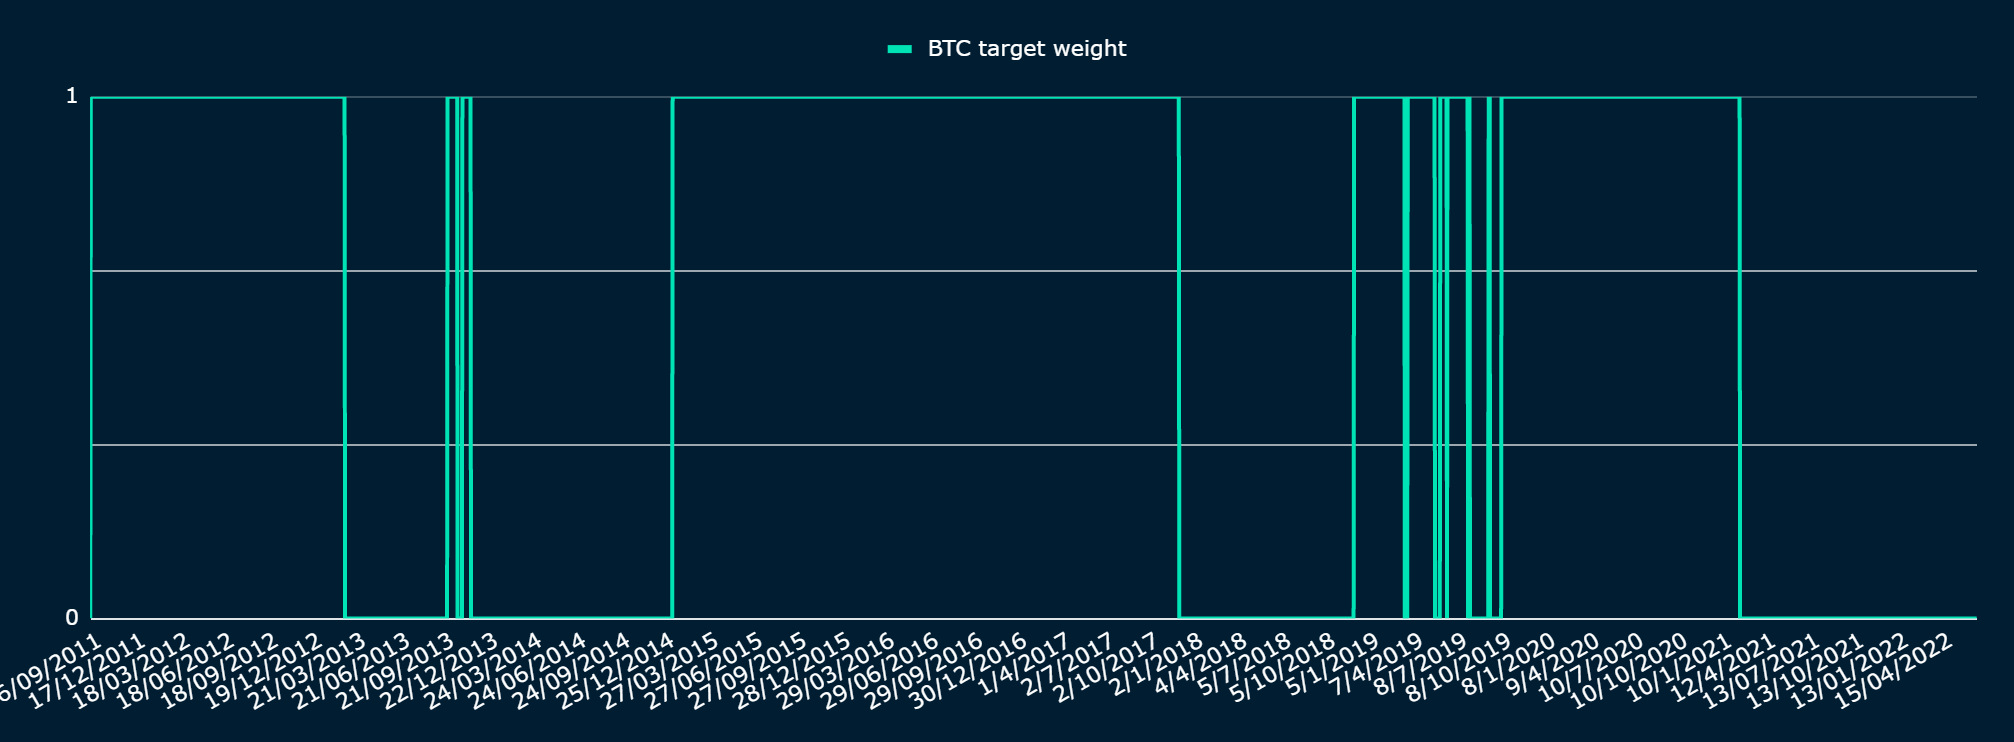
image description
image description
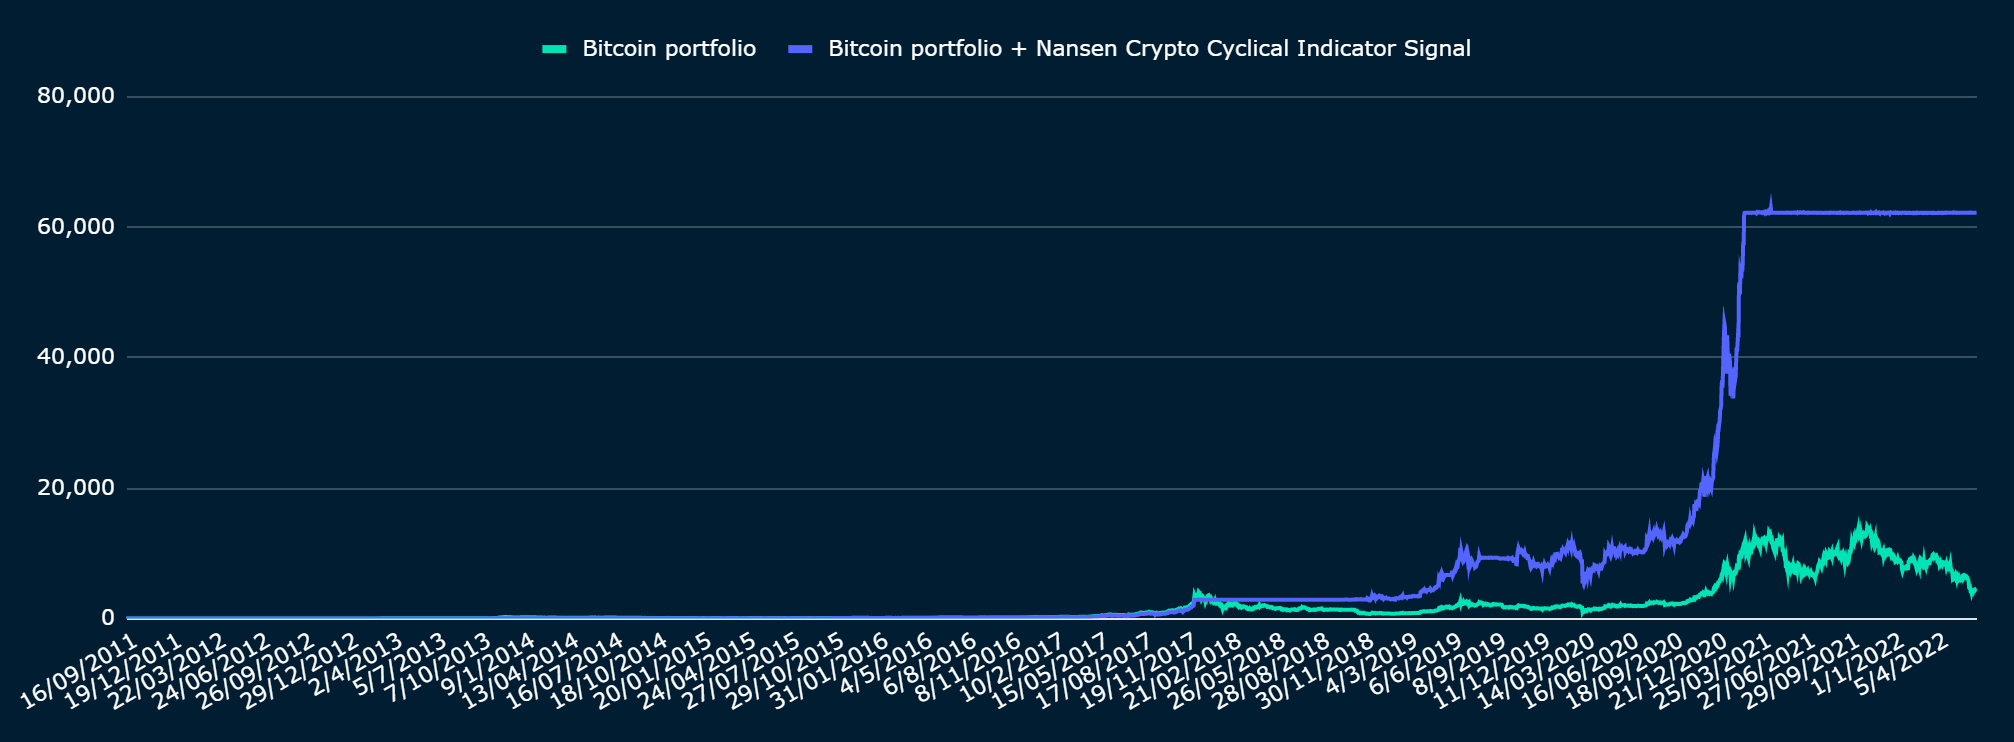
image description
secondary title
1.5 NFT market cycle
image description
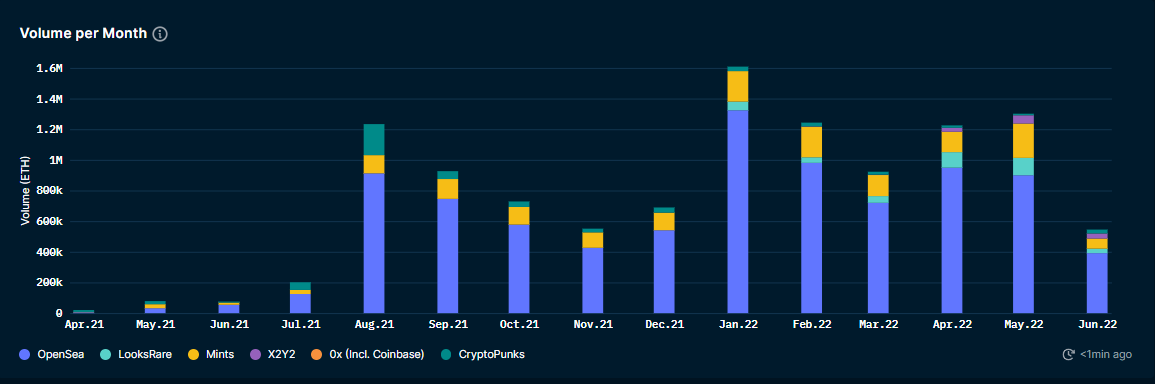
image description
image description
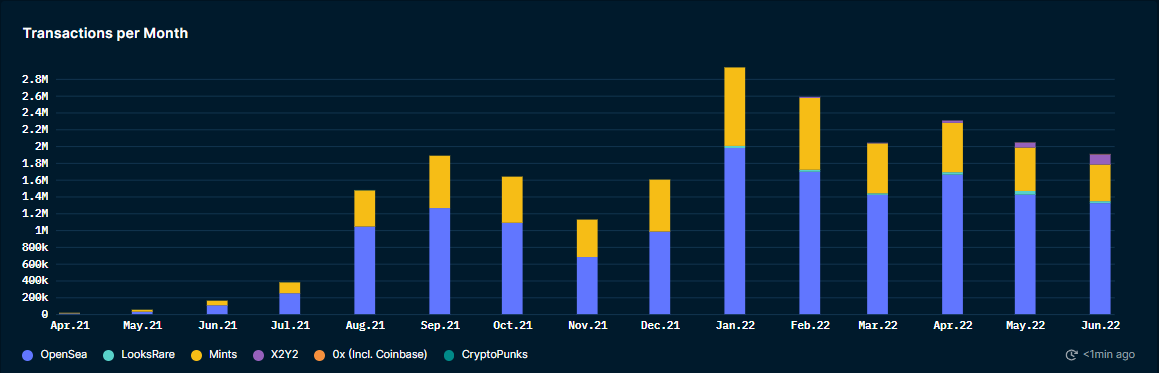
image description
Source: Nansen dashboards
However, in June, the Nansen NFT-500 index and the Blue Chip-10, Social-100, Art-20 and Metaverse-20 indices all showed a slight reversal trend (see Figure 11). It is worth noting that the Art-20 index had the largest increase of +32.6%; from 739 points at the beginning of June to close at 980 points at the end of the month.
image description
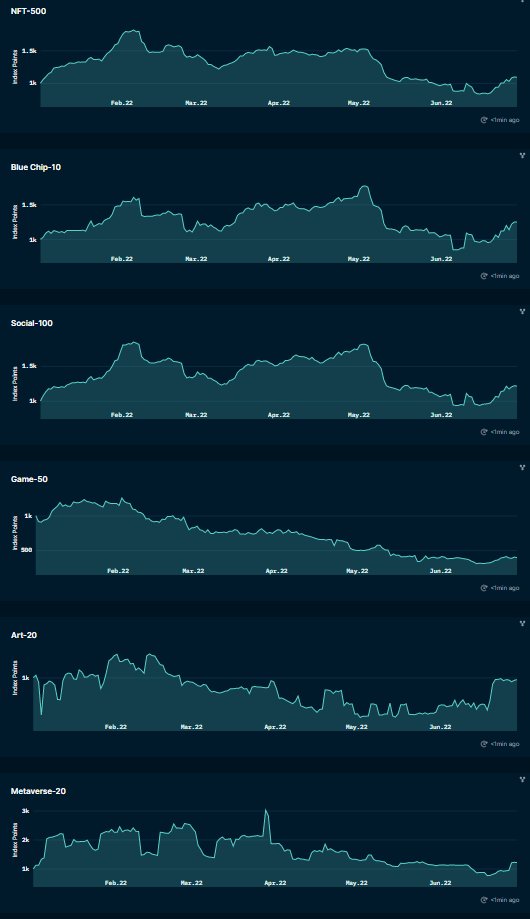
image description
image description
image description
first level title
2. The generation gap of sentiment indicators of investors in the NFT market
While several micro- and macro-financial indicators are relied upon when pricing traditional financial assets, the nascent nature of NFTs and the broad crypto market means that there are few or limited reliable market indicators to help determine an asset's valuation and market sentiment. In the absence of reliable indicators, NFT market sentiment is driven by investor speculation (seeGunay & Muhammed, 2022).
Unlike crypto assets like Bitcoin or Ethereum, NFTs are non-fungible, meaning each token is uniquely identifiable, holds a different value, and represents a unique instrument. The unique non-fungible nature of NFT introduces new ways to adopt and implement blockchain technology for various applications.
Although there has been controversy about the scarcity dimension of NFT (Chohan,2021), but innovative ways to leverage the properties of NFTs are emerging. For example, NFTs are used to record and represent art collections (Kugler,2021). Other notable applications include assigning rights to other (digital) assets (Wilson、Karg & Ghaderi,2021), ownership of land and assets in the Metaverse, implementation of the Internet of Things (IoT) (Arcenegui, Arjona and Baturone, 2021), peer-to-peer energy trading (Karandikar, Chakravorty and Rong, 2021), and even wildlife protection (Mofokeng and Fatima, 2018). Additionally, our previousNFT Index Methodology, the paper analyzed more than 500 NFT collections, allowing us to identify four major categories of NFTs—art, social, games, and metaverse. A key observation from this analysis is that NFT assets have multiple use cases and can be broken down into multiple NFT categories.
Given that traditional valuation models do not necessarily apply to crypto assets, the focus has shifted to exploring investor sentiment to navigate this market. Furthermore, existing literature shows that cryptoasset markets are inefficient and do not meet the efficient market assumption (Anamika, Chakraborty and Subramaniam, 2021). This paper is thus an early attempt to investigate the role of investor sentiment in determining the price behavior of NFTs. This article focuses on NFTs as an asset class (which will subsequently be referred to as the "NFT market"), rather than collections of NFTs of individual assets. Our main goal is to identify proxies for investor sentiment that can explain NFT price behavior. Proxies for investor sentiment chosen for this analysis include models, such as the regression of price to past realized volatility, as well as quantitative measures of volume, sales velocity, and even the appearance of social media “NFT” searches.
first level title
secondary title
3.1 Traditional Finance: Defining Risk Appetite Indicators
In traditional finance, "risk appetite" metrics help assess the likelihood of market peaks and troughs (Literature: Illing & Meyer, 2004). Risk appetite includes investors' risk perception of asset price uncertainty, as well as the level of uncertainty surrounding asset price fundamentals themselves. None of these components are directly observable, but the latter are usually not too difficult to estimate.
image description
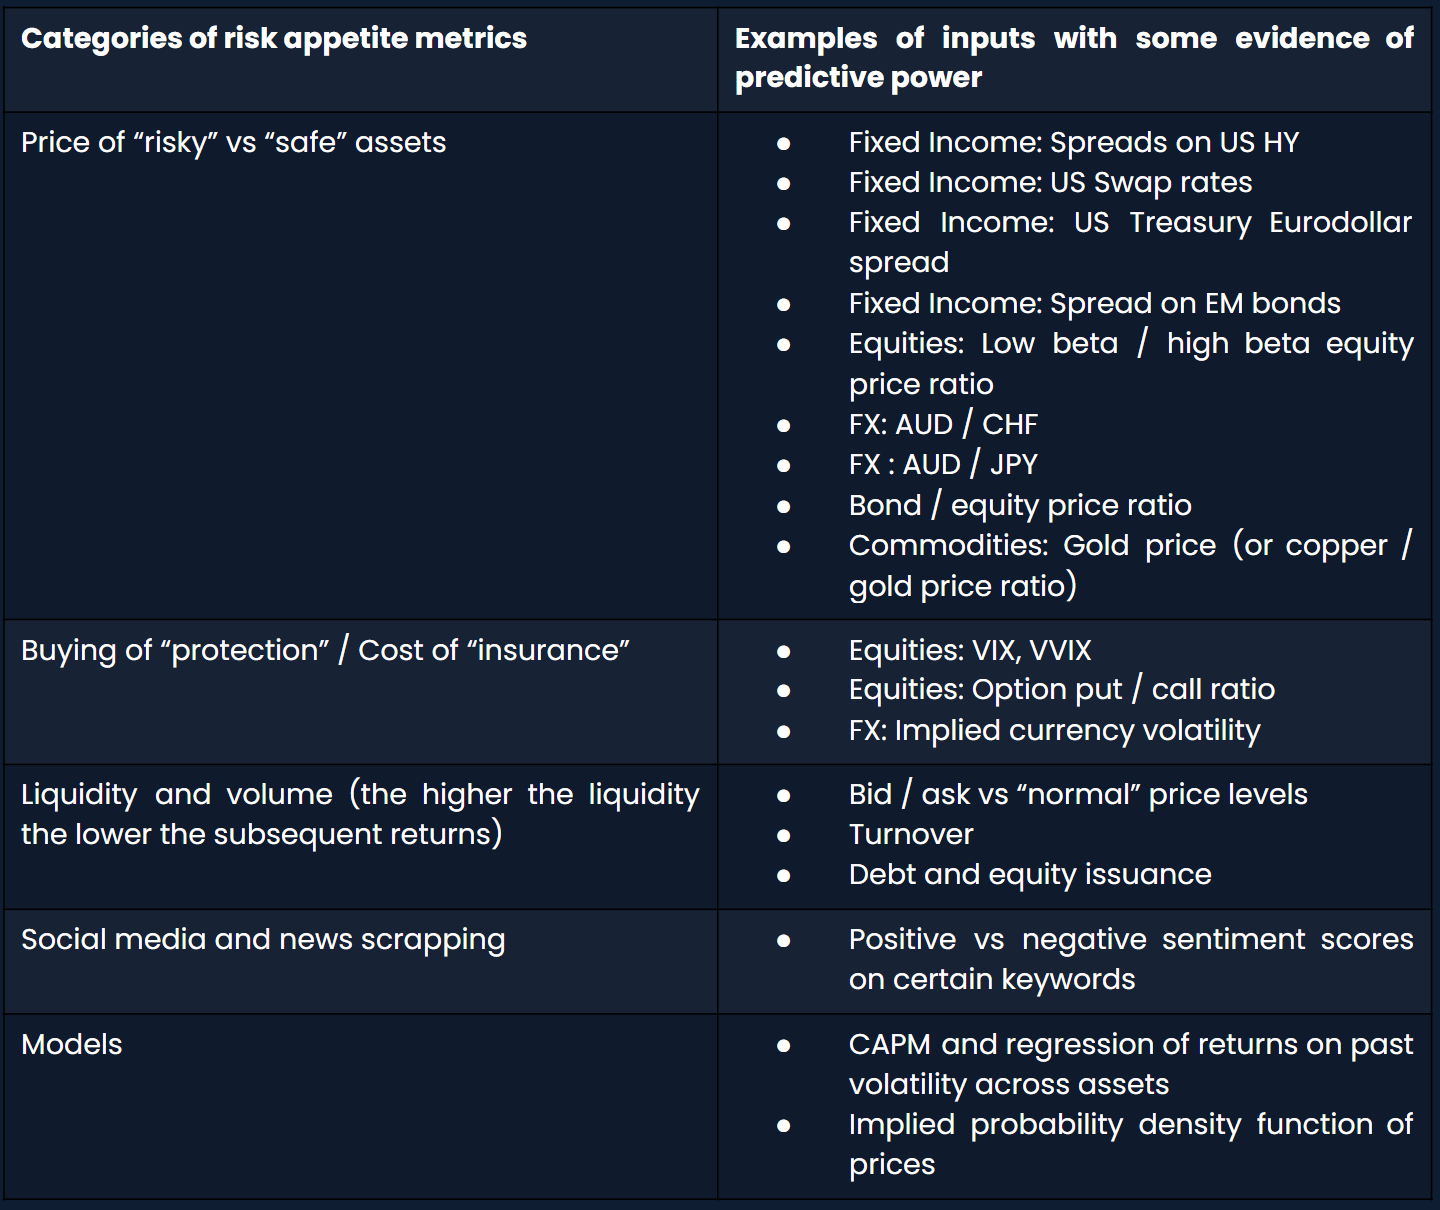
Figure 13: Overview of factors and models applied to estimate risk appetite for traditional financial assets
secondary title
image description
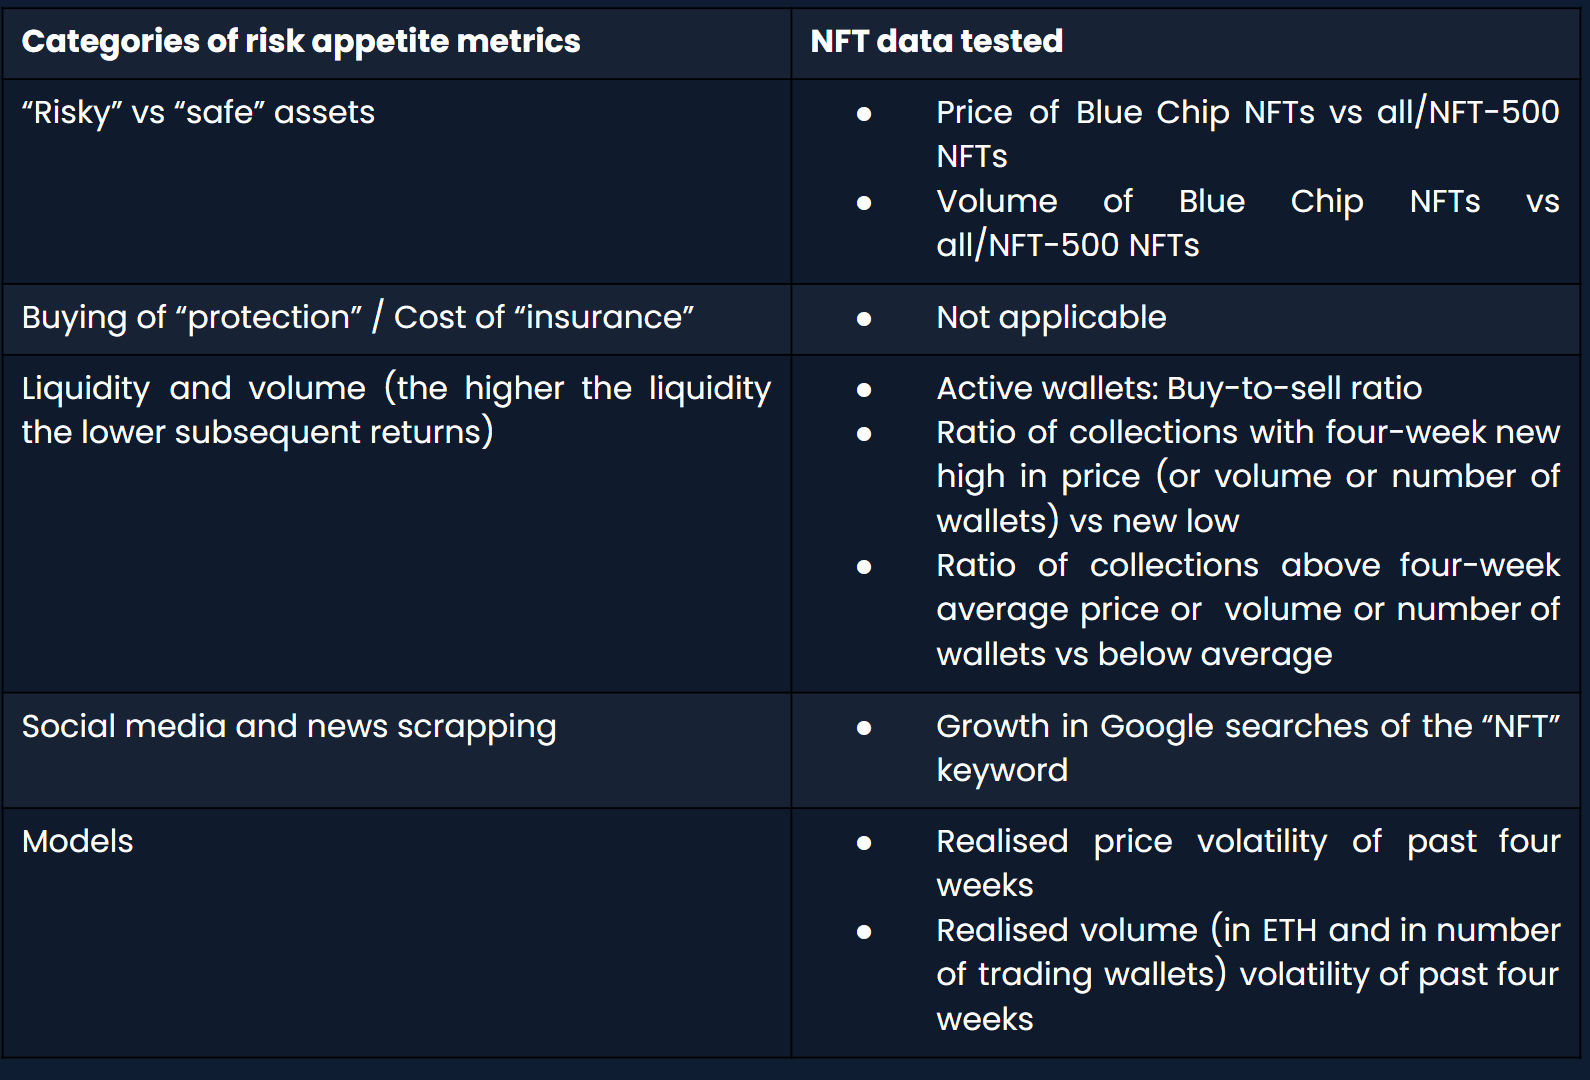
Figure 14: Overview of factors and models tested to measure NFT risk appetite
The NFT metrics listed above were mostly generated using statistics from on-chain NFT sales price, volume, from/to wallet addresses, with the exception of the Google search metrics:
Price of Blue Chip NFTs vs All/NFT-500 Large Cap NFTs, and Volume of Blue Chip NFTs vs All/NFT-500 NFTs: These metrics measure investor preference for perceived "safer" assets, such as Blue Chip NFTs in NFT Markets dominance of
Active wallets: There is an argument to consider the network effects of cryptoassets when evaluating NFTs (Cornell University Papers, 2021). We believe that by measuring wallet activity, we can understand the interest of network participants in the NFT market.
Buy-to-sell ratio of active wallets: This indicator measures wallet demand for NFTs.
Ratio of NFT collectibles with new highs in price or volume or number of wallets over the past four weeks to new lows / Ratio of collectibles above four-week average price or volume or number of wallets to collectibles below average: Measuring price or Momentum indicator for volume strength
All metrics are aggregated in three subsets:
All transactions on the Ethereum network
Volume filtered for portfolios belonging to the Nansen NFT-500 Index (see definition in section 3.3 below)
secondary title
text
NFT-500 is a broad market index that tracks market activity for NFTs issued on the Ethereum blockchain (ERC-721 and ERC-1155). The index will be launched on January 1, 2022. The benchmark index consists of a collection of no more than 500 NFT projects, weighted by market capitalization. The index is designed to track activity and movement in the NFT market. The benchmark index is calculated daily and rebalanced every 30 days, with index constituents reassessed and rebalanced accordingly. For an NFT to be included in the index, it needs to meet:
a) Secured on the blockchain using smart contracts (at this stage, the Nansen Index only tracks those issued on Ethereum);
b) have completed at least 100 transactions in the past 90 days, half of which have unique wallet addresses, and
c) At least 1000 ETH transaction volume if the NFT collection’s trading volume in the past 90 days is freely traded, and the collection has no or no undue risk of foreseeable liquidity shock
text
II. Benchmark of NFT Basket Index
image description
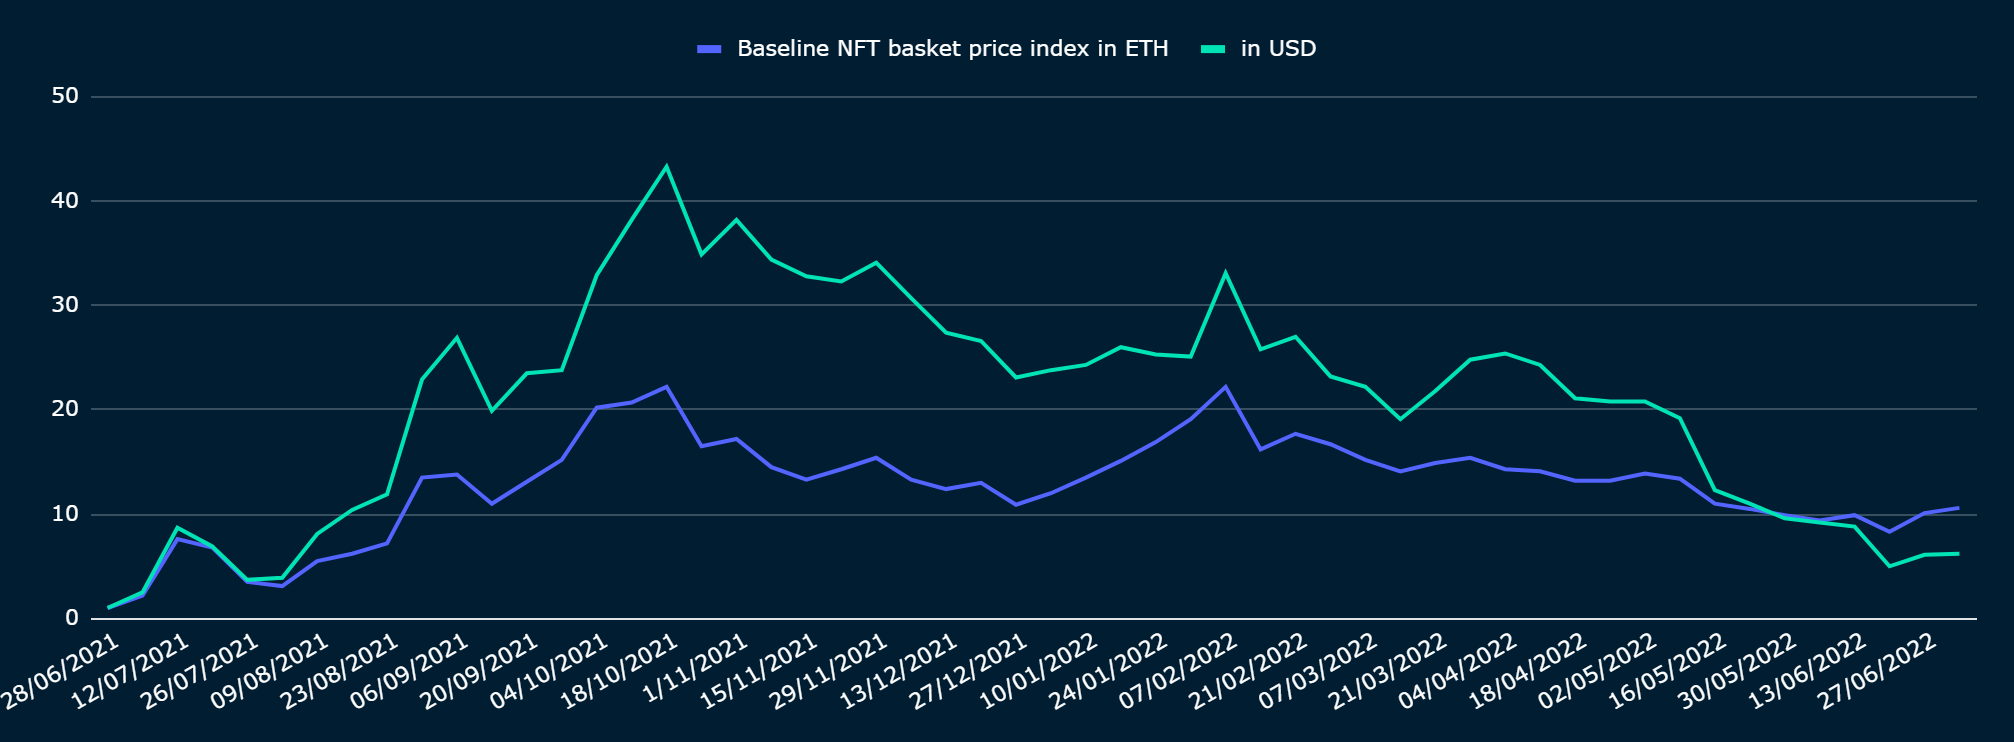
image description
image description
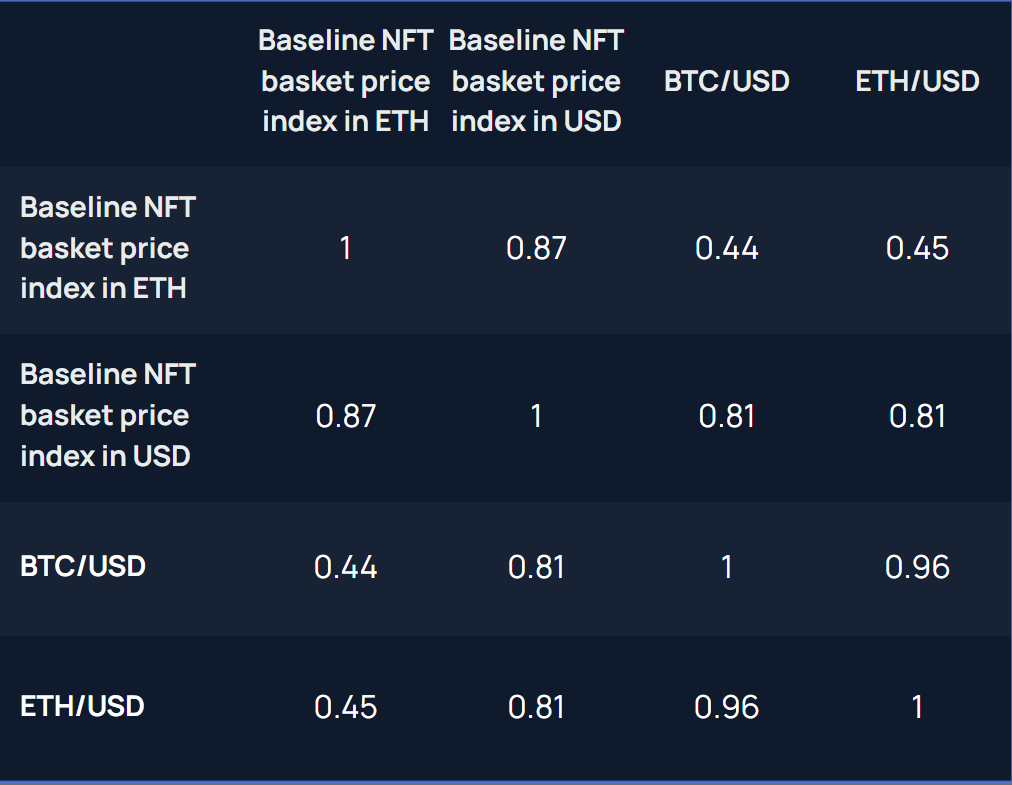
image description
Source: Nansen Query, Nansen analysis
first level title
4. Findings and Interpretation
Using our constructed benchmark of 7-day USD price returns for the NFT portfolio index as the dependent variable, we perform a multivariate generalized least squares regression on the NFT indicators presented in Section 3.2.
image description
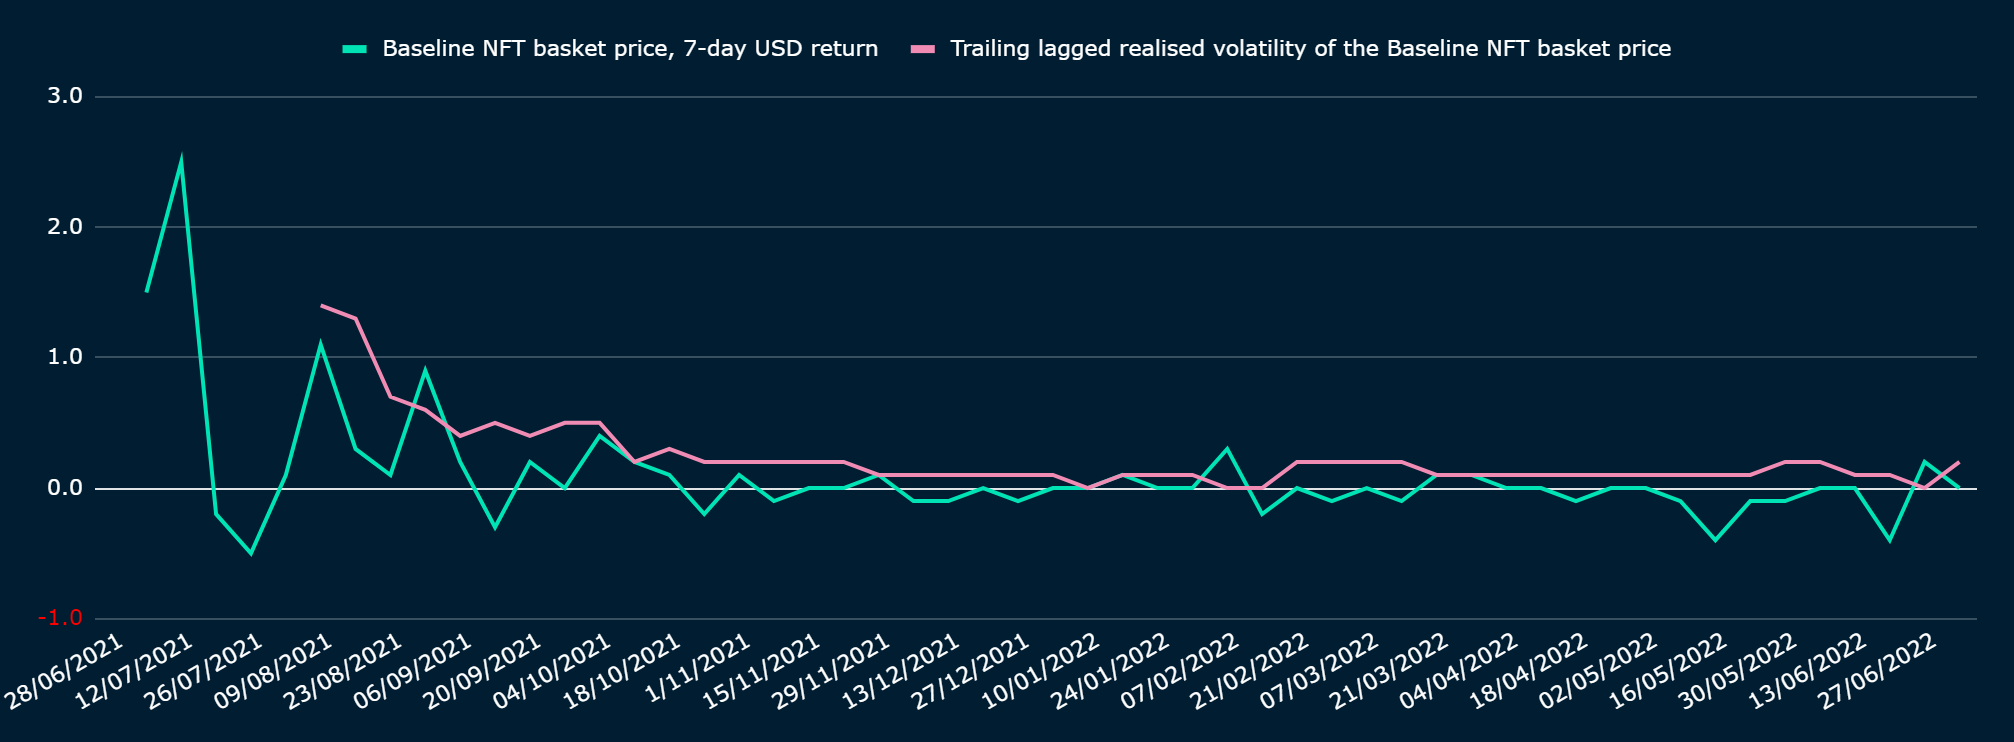
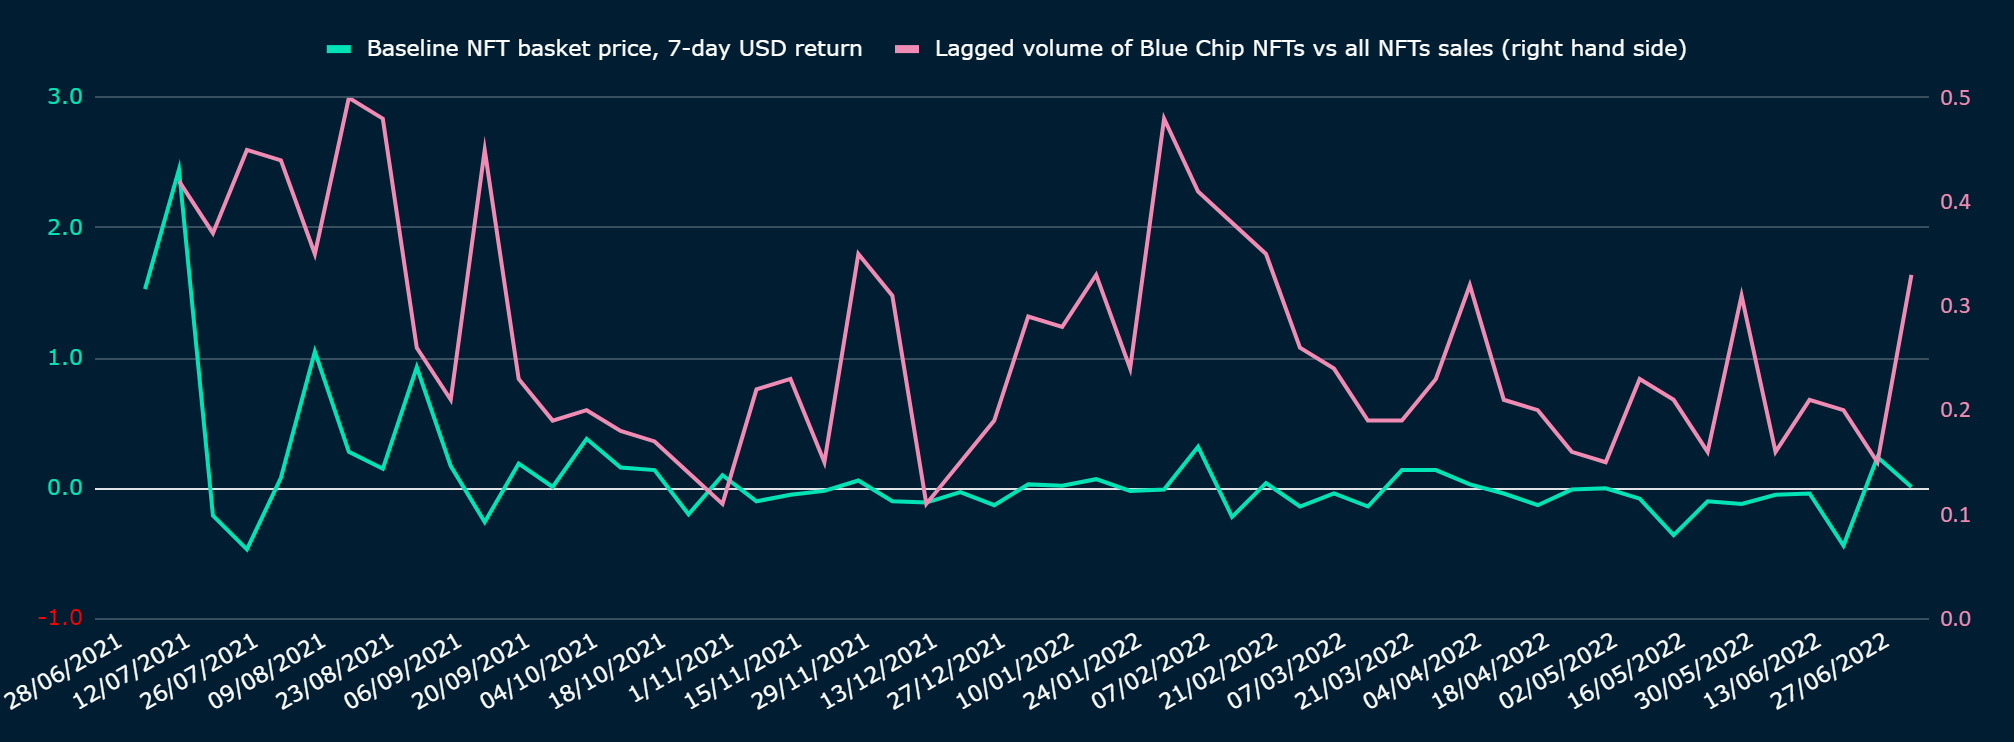
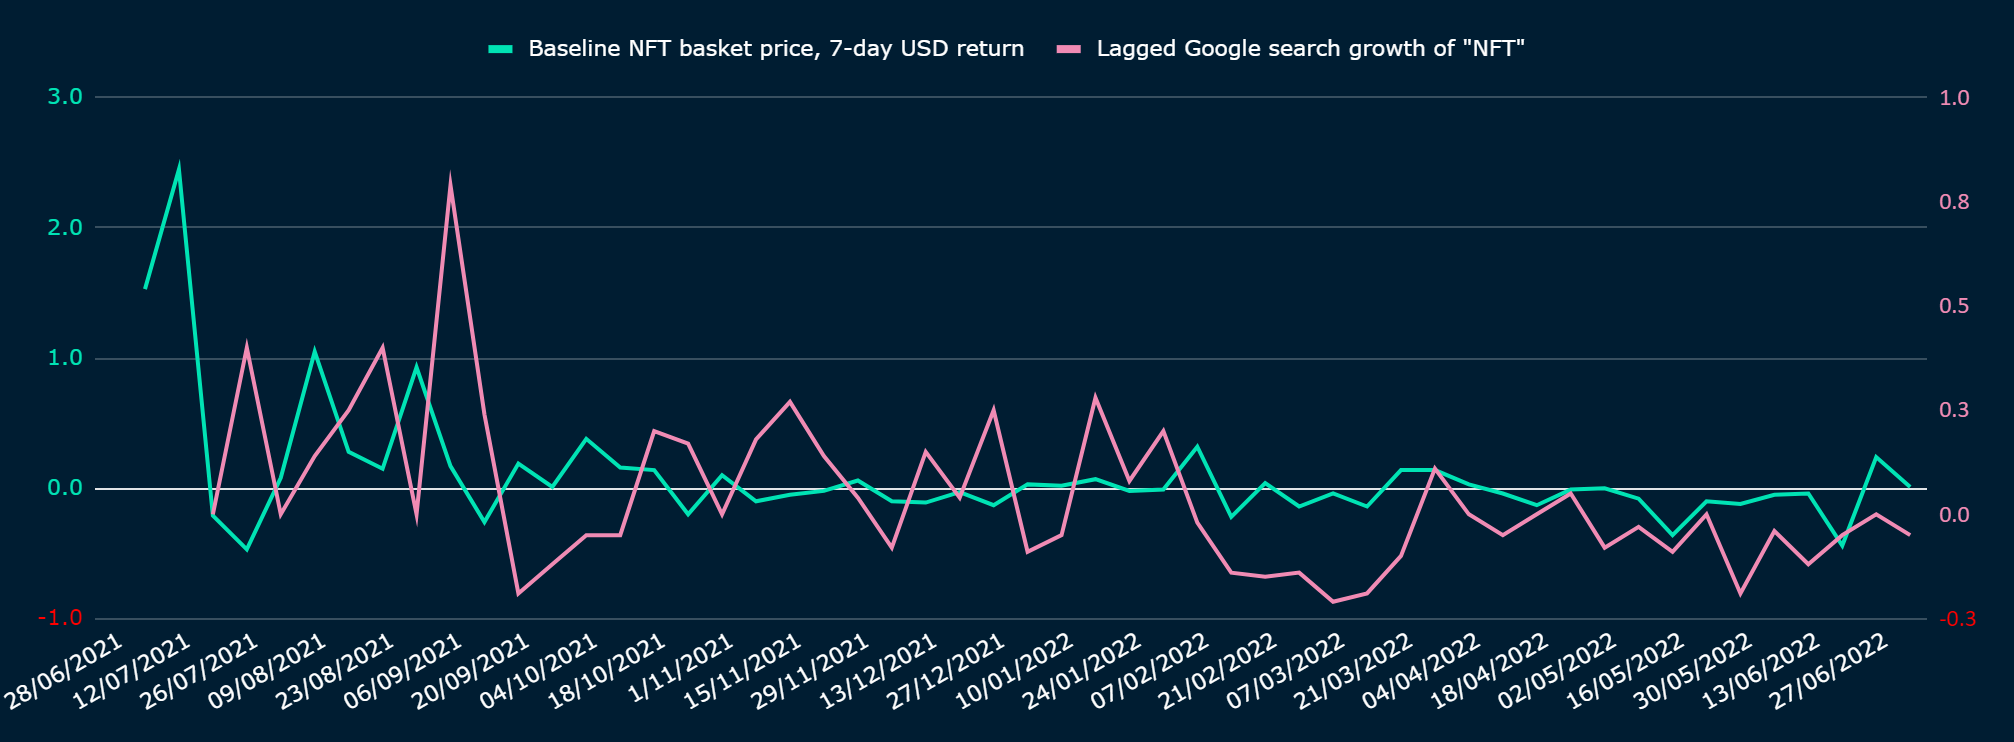
image description
Source: Nansen Query, Nansen analysis
After controlling for statistical bias, we found two variables with relatively high predictive power in the sample (regression results seeFigure 18):
Realized volatility tracking the price of a benchmark NFT portfolio:A positive correlation coefficient means higher realized volatility predicts higher forward weekly returns
Blue chip NFT volume vs. all NFT volume:image description
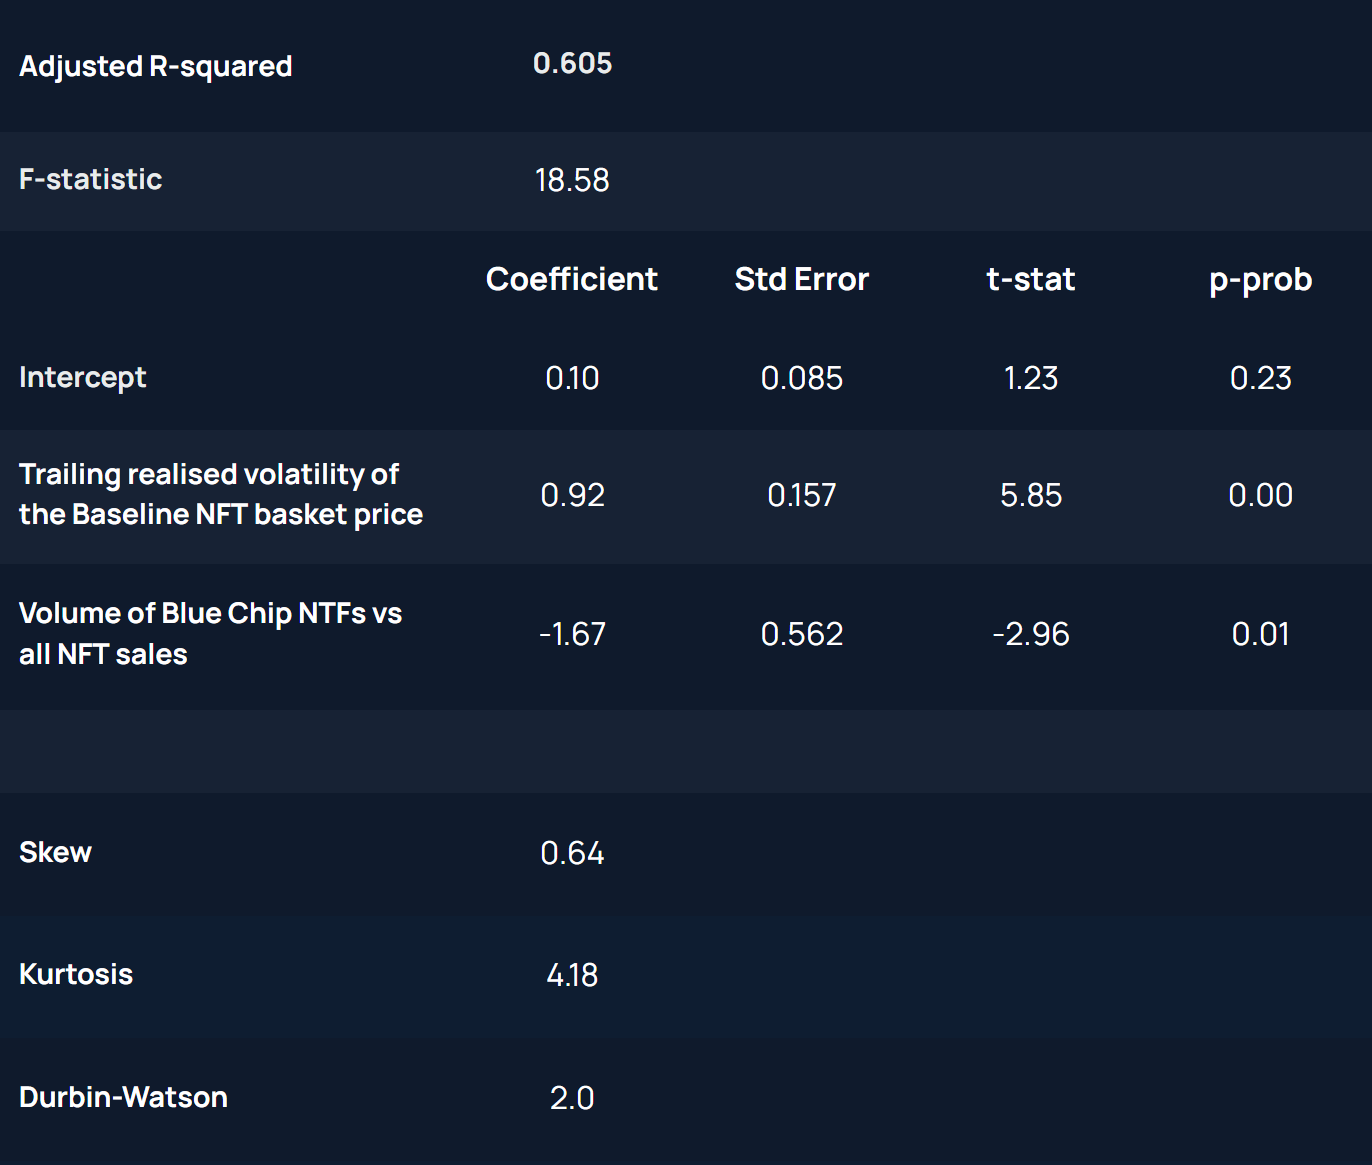
image description
Source: Nansen analysis
To test our out-of-sample regression results (January 2022 to June 2022), we simulated a strategy that invests in a benchmark of NFT portfolio prices when our investment signal is positive and negative when it is negative is neutral (cash). We opted for a weekly review of signals. We use the coefficients found in the sample, applied to two time series of realized volatility and blue-chip pair all sales volume to generate investment signals.
image description
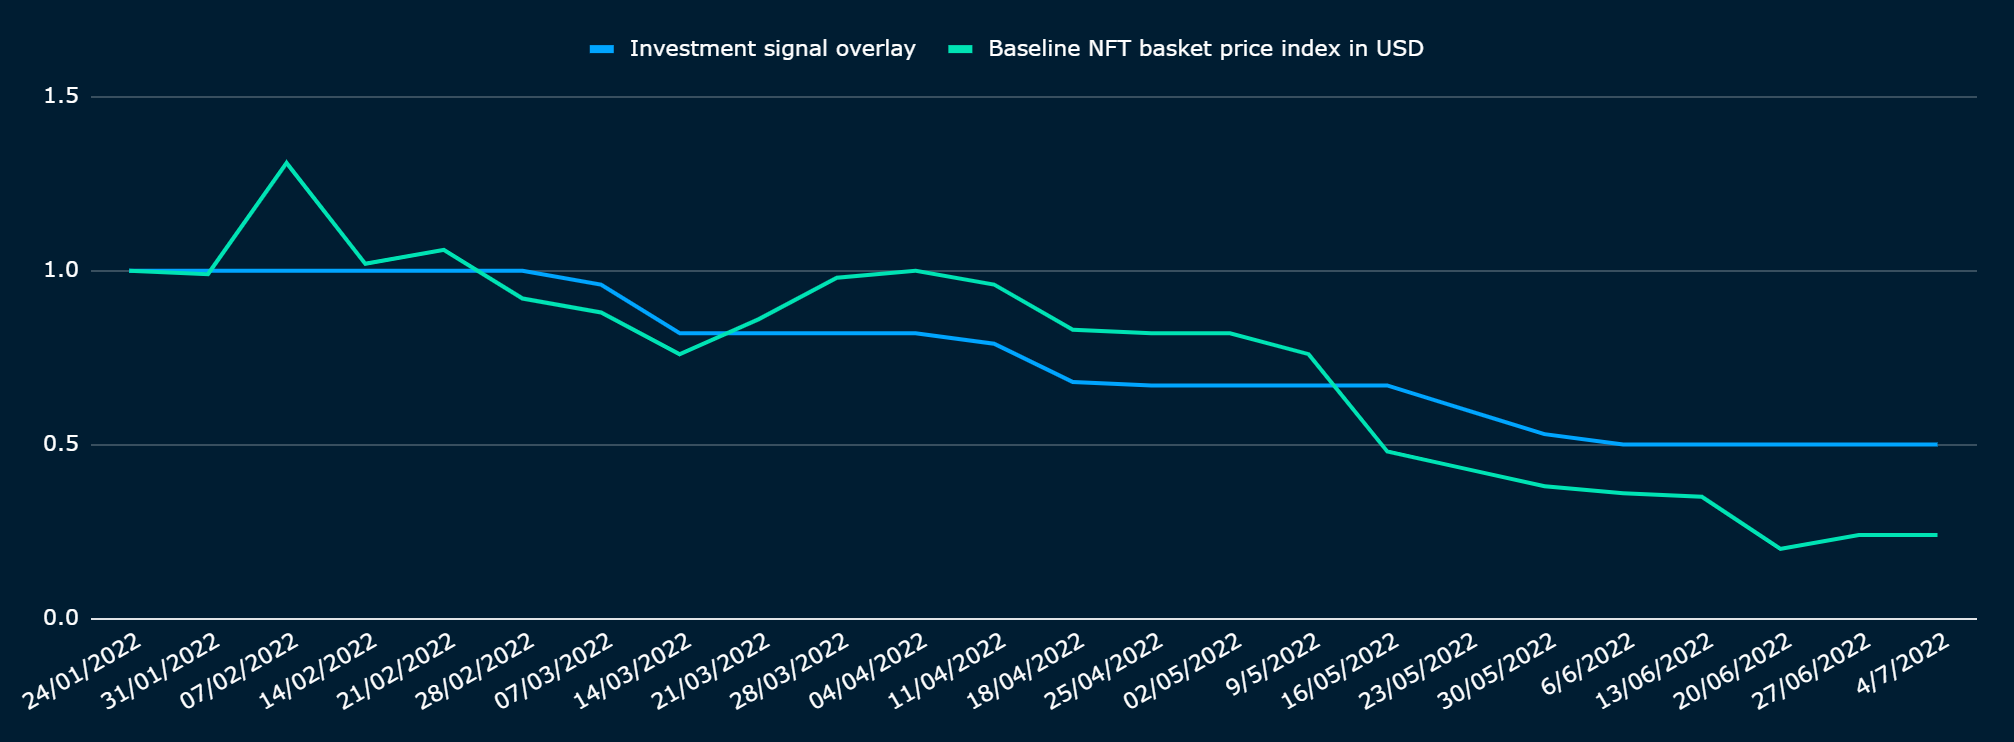
image description
image description
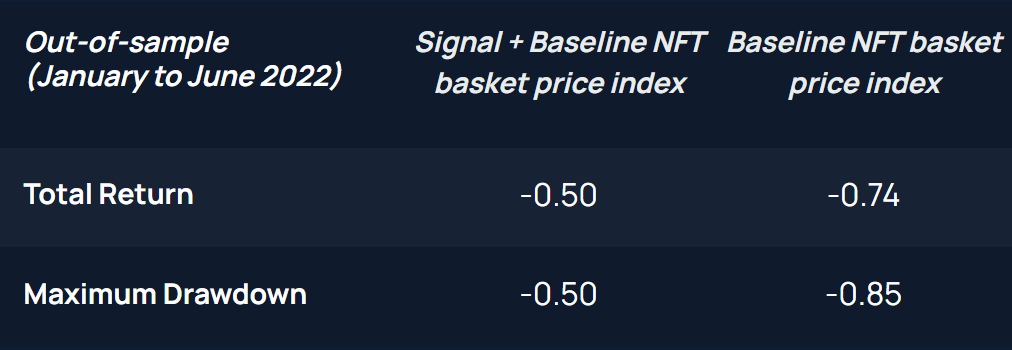
image description
image description
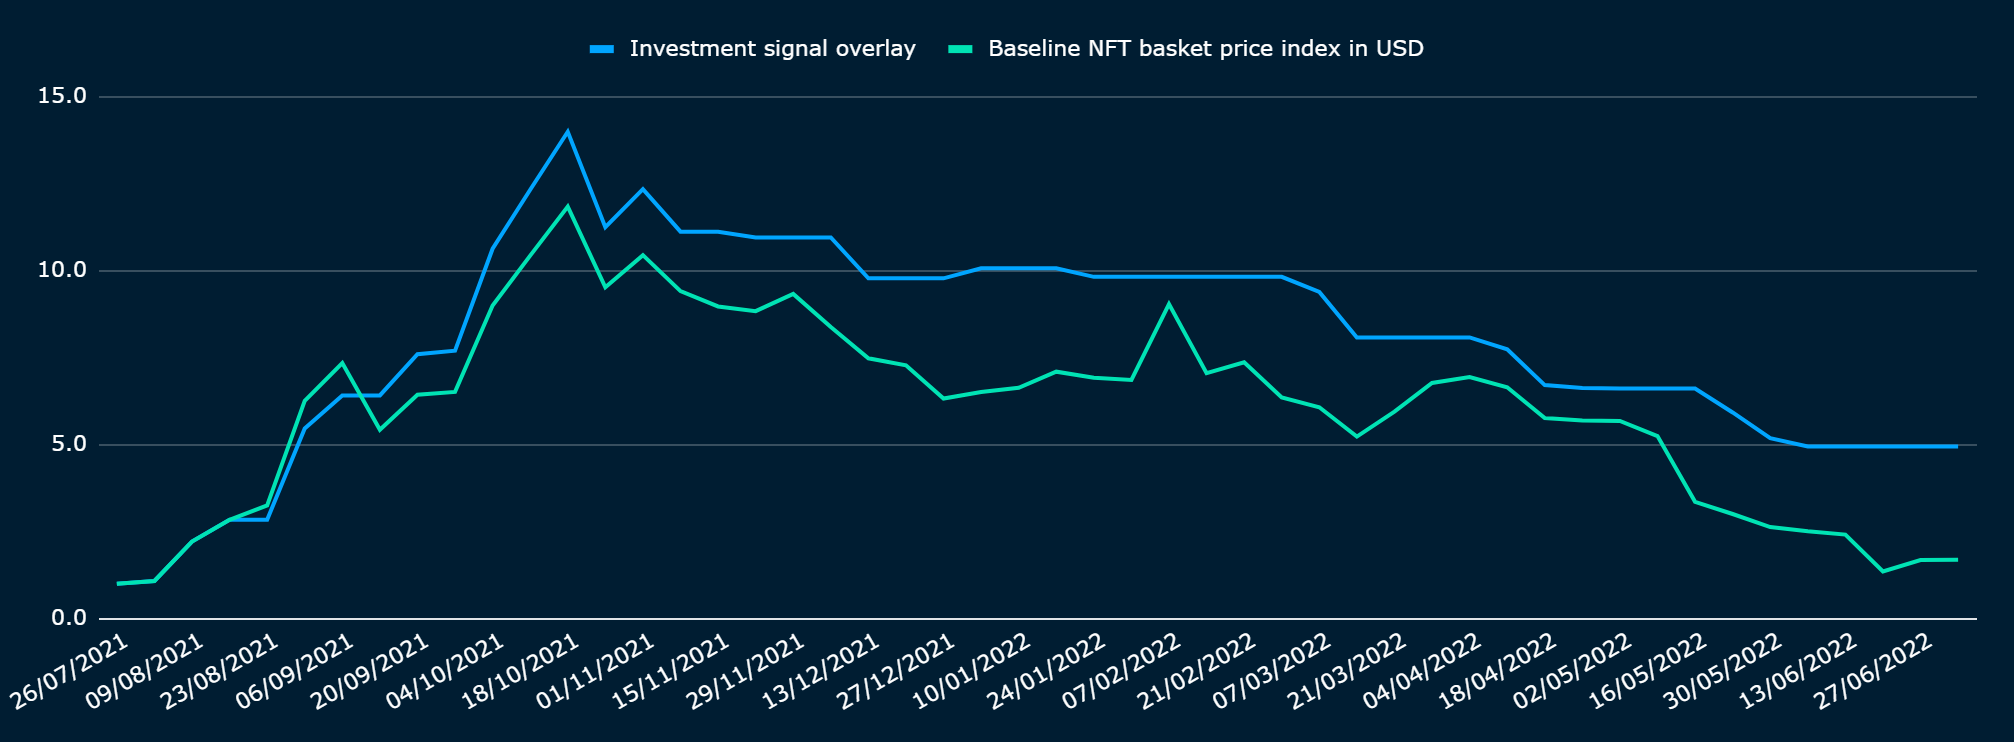
image description
image description
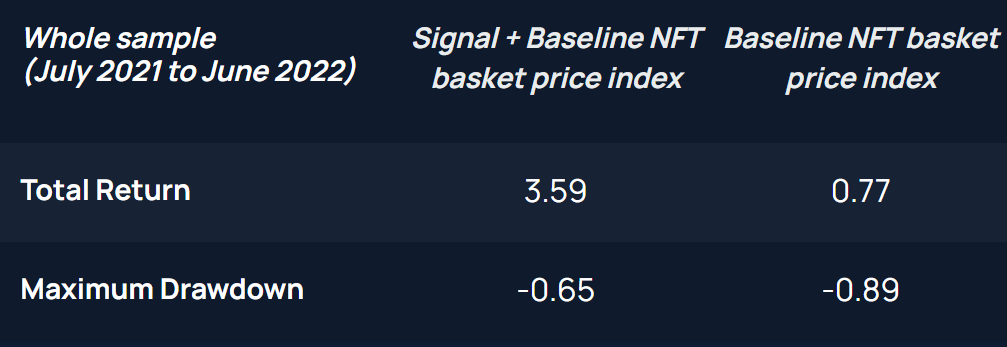
image description
first level title
5. Limitations and conclusions
Although still in a high-growth stage, it is important to understand the price behavior of NFT as an asset class, and its market sentiment may be different from that of alternative encrypted assets. In this article, we explore the potential of NFTs to present unique opportunities in the broad cryptoasset market and examine their price action against the sentiment of market participants.
We found relatively high NFT price predictions for two on-chain metrics: trailing realized volatility for the NFT portfolio price benchmark and blue-chip NFT vs. all NFT volume. Volatility has traditionally been a good measure of investor risk appetite, and the shift from blue-chip NFTs to small-cap NFTs may indicate that investors are willing to take on risk for more return (i.e., investors are arguably greedy indicators) and vice versa for fear). Based on these two metrics and our regression coefficients, we created a "fear and greed" sentiment indicator to track the NFT market.
As we go through at least one full NFT "cycle," more real-time data points should help validate the robustness of this metric. In fact, the out-of-sample data used captures only a few months. Our forward horizon is also limited to one-week forecasted NFT price returns, and with more data we aim to increase this time frame to help capture larger "peaks and troughs".
Sentiment indicators also have value for traditional coins: Nansen stablecoin preference indicator marks price consolidation from May.
Sentiment must be complemented by fundamental indicators for a deeper understanding of asset cycles. Our key macro conclusion is that we are entering a sharp slowdown in global real growth, which could prompt policymakers to pause monetary policy tightening until the first quarter of next year, which could lead to a preemptive rebound in cryptocurrency prices.
Disclosure:Authors of this content and members of Nansen may participate in or invest in certain protocols or tokens mentioned herein. The above statement serves as a disclosure of potential conflicts of interest and is not a recommendation to purchase or invest in any tokens or to participate in any agreement. Nansen does not recommend any particular course of action related to any token or protocol. The content here is for educational and informational purposes only and should not be considered financial, investment, legal, tax or any other professional or other advice. None of the content and information provided here is intended to induce or attempt to induce any reader or other person to buy, sell or hold any tokens or enter into any agreement, or to buy or sell any tokens or enter into any agreement for or in connection with viewing . Statements made herein (including statements of opinion, if any) are entirely general and are not tailored to take into account the individual needs and unique circumstances of any reader or anyone else. Readers are strongly urged to exercise caution and consider their own individual needs and circumstances before deciding to buy or sell any tokens or participate in any agreement. Nansen may change the opinions and opinions expressed here at any time without notice. Nansen disclaims all liability for any loss or liability arising from use of or reliance on any content.