secondary title
What is MA?
The full English name of MA is Moving Average, and the Chinese translation is moving average, also referred to as moving average. It is a technical analysis indicator created by American investment expert Joseph E. Granville in the middle of the 20th century.
In essence, the moving average MA shows the average transaction cost of buyers or the average selling price of sellers in the past period of time, which can be regarded as the consensus reached by buyers and sellers on asset prices in the past period of time. And when there is a gap between the latest price of an asset and the past market consensus, it may mean that the trend will change.
secondary title
MA calculation formula
According to the calculation method, the moving average MA belongs to the arithmetic average, that is, the price in a period of time is added, and then divided by the period. In short, the moving average is the average price. The calculation formula is:
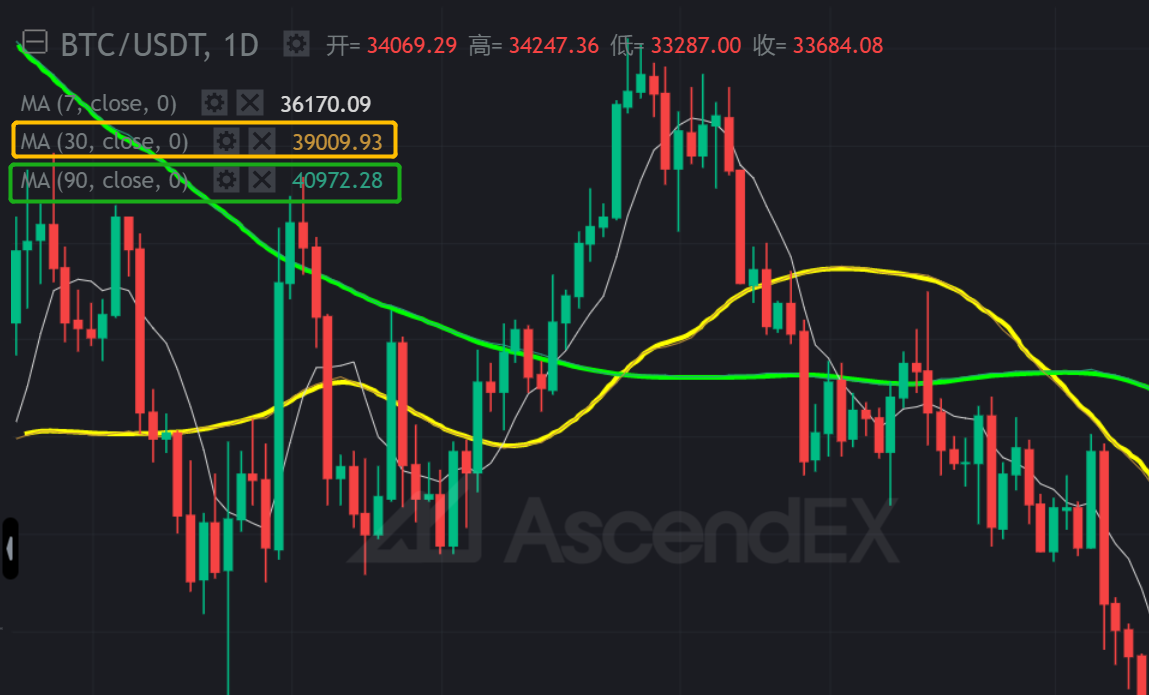
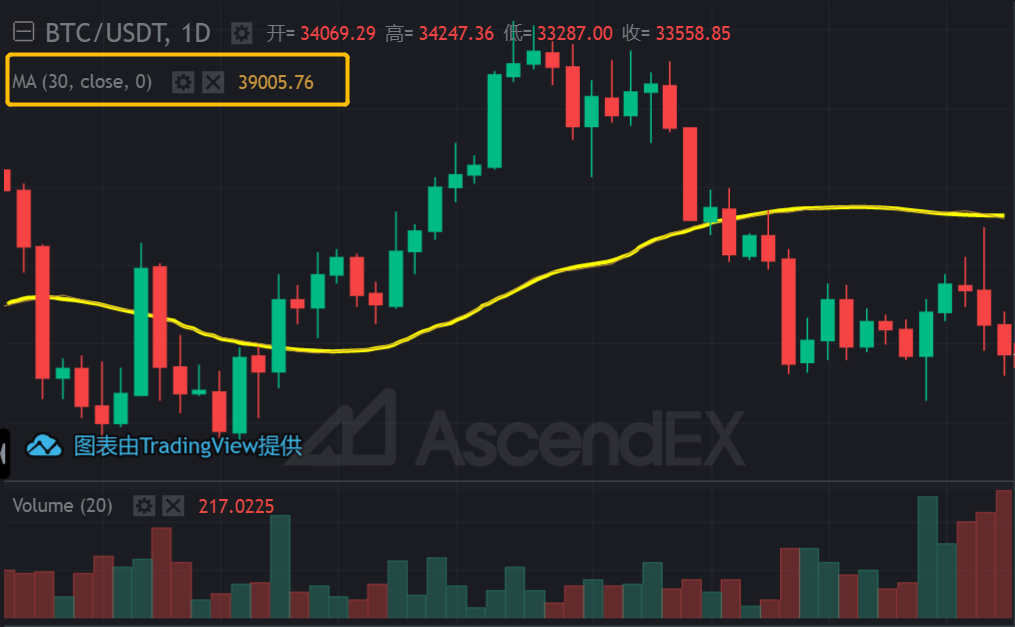
Taking the daily moving average as an example, to calculate the BTC 30-day moving average (30MA, daily K-line), it is to add up the closing price of BTC in the past 30 days (including the latest day) and divide it by 30. Then connect the 30-day moving average corresponding to the daily K-line to get a BTC 30-day moving average.
secondary title
What are the types of MA?
In practical applications, there are many types of MA. Here, we mainly introduce several common types of moving averages based on the two major divisions of time period and data weight.
(1) Divided by time period
According to different time periods, the moving average can be divided into corresponding time period moving averages. Common time period moving averages such as: minute moving average, hourly moving average, daily moving average, weekly moving average and monthly moving average can be compared to different time periods of the K-line chart.
In the traditional stock market, commonly used moving averages are:
The 5-day line (MA5) is also called the weekly line, and 5 trading days are 1 week;
The 10-day line (MA10) is also called the biweekly line, and 10 trading days are 2 weeks;
The 20-day line (MA20) is also called the monthly line, and the 20th trading day is nearly a month;
The 60-day line (MA60) is also called the quarterly line, and the 60th trading day is nearly one quarter;
The 120-day line (MA120) is also called the half-year line;
The 240 day line (MA240) is also called the year line.
The moving averages listed above are only the types commonly used by most traders. In practical applications, the specific time periods of moving averages are not necessarily integers. Traders can use their favorite or more appropriate specific numbers. For example, for the 20-day line, some traders use the 22nd as the monthly cycle; for the 240-day line, some traders use the 252-day as the annual cycle. In addition, the time period used by the traditional stock market trading moving average is based on the trading day, while the digital currency trading market does not have the concept of trading day because it is open all year round. Periodic moving average.
At the same time, according to the different trading cycles of different types of traders, the moving averages used are also different. The common types are as follows:
The moving averages of the above different time periods are also often referred to as short moving averages, medium moving averages, and long moving averages, but there is no strict distinction.
(2) Divided by data weight
According to the different data weights used when calculating the average value, it can generally be divided into three types: simple moving average, exponential moving average and weighted moving average.
(1) Simple Moving Average - SMA (Simple Moving Average)
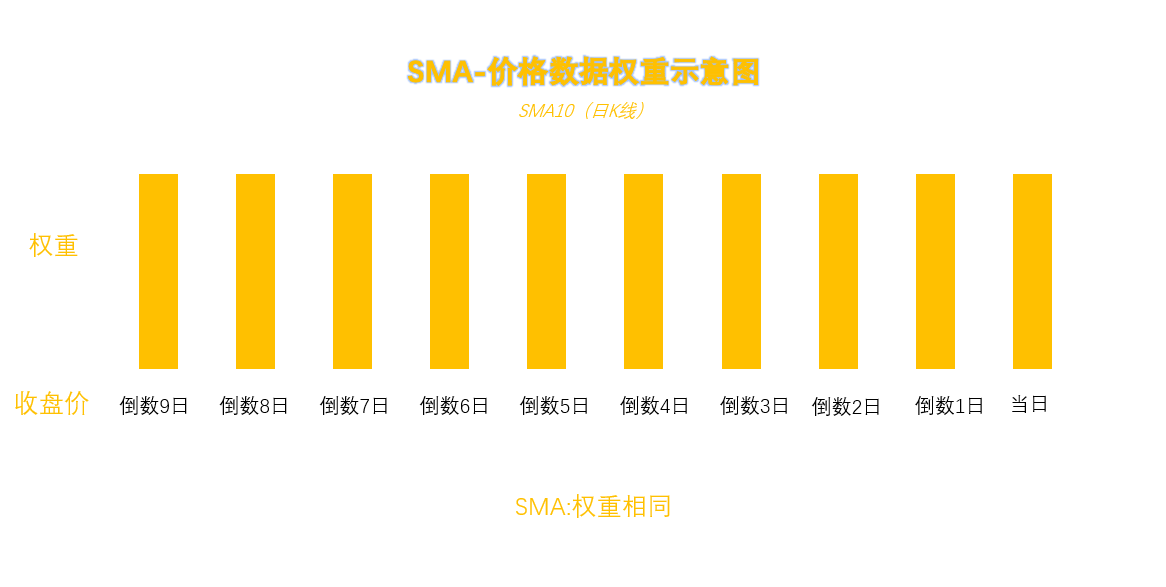
The simple moving average SMA is equivalent to the moving average MA, and its calculation method is the same as the MA calculation method, and all reference data adopt equal weight. In technical analysis, when it comes to MA, it generally refers to SMA.
As shown in the figure, all data are equally weighted when calculating SMA. In other words, in SMA10 (daily K-line), the closing price of the latest day is as important as the closing price of the first day 10 days ago. Therefore, this makes SMA attract criticism, because some traders believe that the more recent the price of the transaction, the more important it should be. And it is precisely because of this that the latter two moving averages are extended on the basis of SMA.
(2) Exponential Moving Average-EMA (Exponential Moving Average)
The exponential moving average (EMA) is an average calculated by assigning different weights to it based on the MA based on the newness of the price data. Its calculation method is much more complicated than that of MA. Generally, it is not necessary to do too much research. Common digital currency exchanges and market software will automatically calculate and display it. Traders only need to understand the principles behind it and how to apply it.
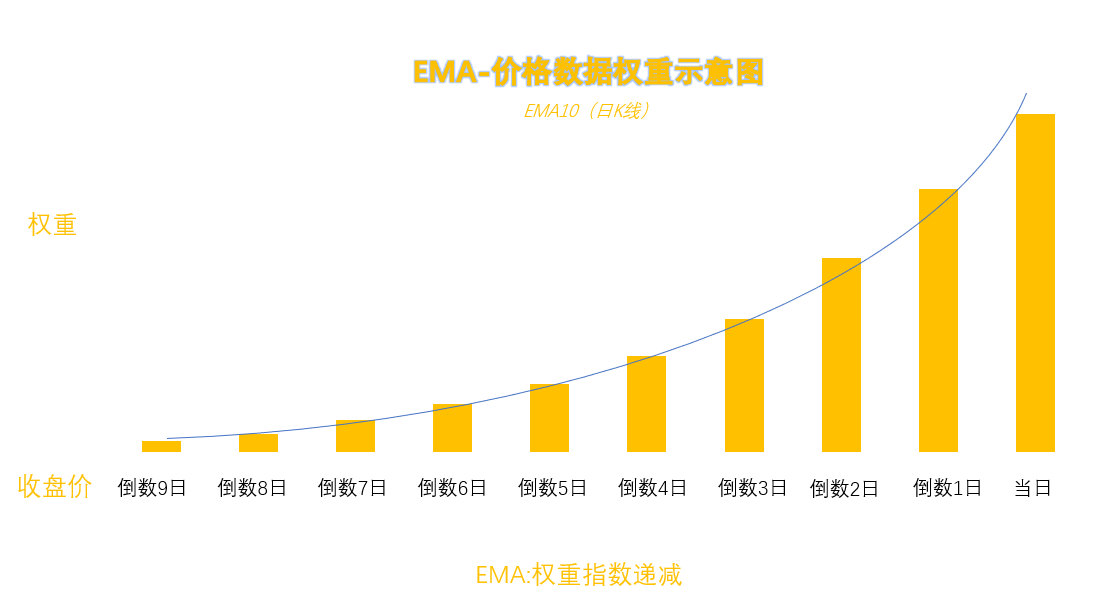
As shown in the figure, in EMA, the weight of the latest price data is relatively the highest. Inversely, the importance of past price data decreases exponentially with time, and the weight of the oldest price data is the lowest. For example, EMA10 (daily K-line), the most recent (the 10th price, that is, the current day) price data has the highest weight, yesterday (the 9th price) has a lower weight, and the day before yesterday (the 8th price) is lower than the 9th price , ... the 10th day (the first price) has the lowest weight. Since EMA assigns more weight to the latest price data, it is more sensitive to price fluctuations and trend reversals than MA, and is more favored by short-term traders.
(3) Weighted Moving Average - WMA (Weighted Moving Average)
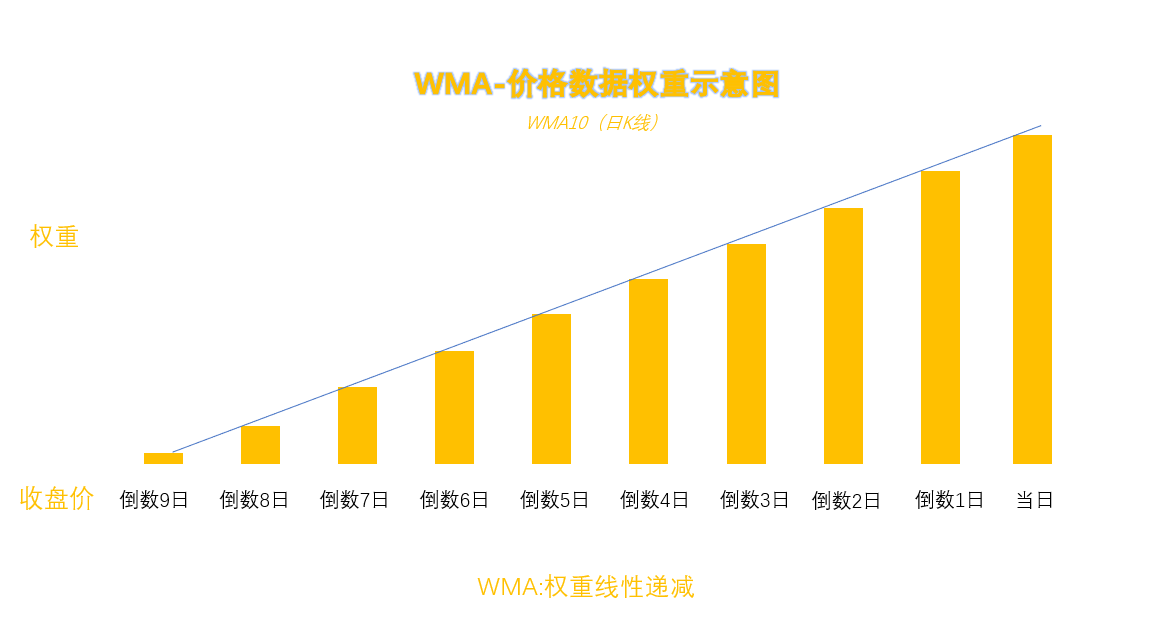
The concept of weighted moving average WMA is the same as EMA. It is also an average calculated by assigning different weights to price data based on MA. The calculation method is also very complicated and will not be discussed for now. However, unlike EMA, WMA's distribution of price data weights is linearly decreasing according to the age of time, while EMA is exponentially decreasing. The difference between the two lies in the magnitude of the decline.
The above three main types of moving averages have different calculation methods and sensitivities to price changes, and corresponding application timings are also different. Traders can choose flexibly according to trading styles and market conditions.
secondary title
How to use MA-assisted analysis?
No matter what type of moving average model is used, the core theoretical basis of the moving average can be summed up in one sentence, that is, the rising average price means that the market is in an upward trend, and vice versa, it means that the market is in a downward trend. The following is a brief introduction to several commonly used moving average analysis methods.
(1) MA and price - to judge the strength of the market trend
If the price crosses the MA line upwards, it means that the market is strengthening and it is a buy signal;
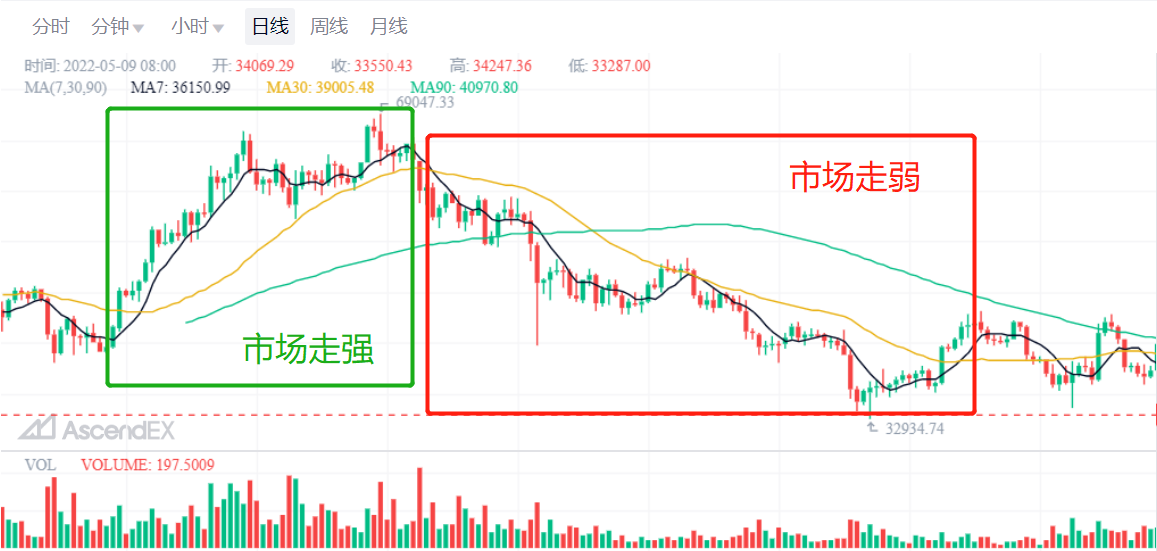
If the price crosses the MA line downward, it means that the market is weakening and it is a sell signal.
Based on this, moving averages are often regarded as support and resistance of a dynamic nature. Moving averages are often used as support lines in uptrends and as resistance lines in downtrends. At the same time, the longer the time period of the moving average setting, the greater the corresponding support or resistance.
(2) Jincha Sicha——buy and sell signal
Golden Cross (Golden Cross) refers to the short-term moving average breaking through the long-term moving average. For example, the 20MA breaks through the 60MA upward. When there is a golden cross, it means that the price may rise in the short term, and there is a swing increase. At this time, it is suitable to enter the market with long orders or leave the market with empty orders.
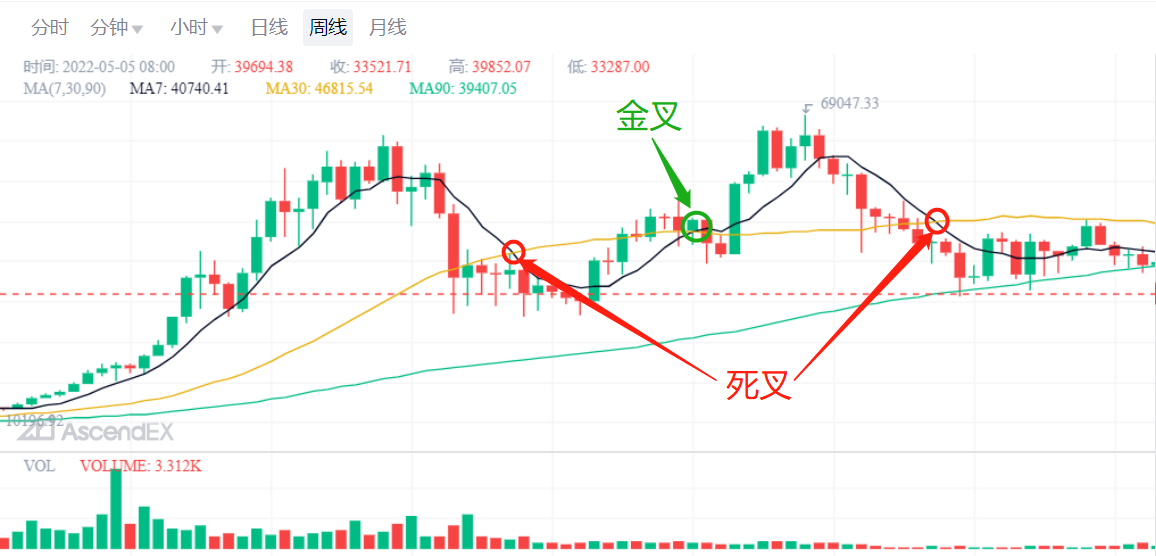
Death Cross, referred to as Death Cross, refers to the short-term moving average breaking through the long-term moving average downward. For example, the 20MA breaks through the 60MA downward. When there is a dead cross, it means that the price may fall in the short term, and there is a swing decline. At this time, it is suitable to enter the market with empty orders or leave the market with long orders.
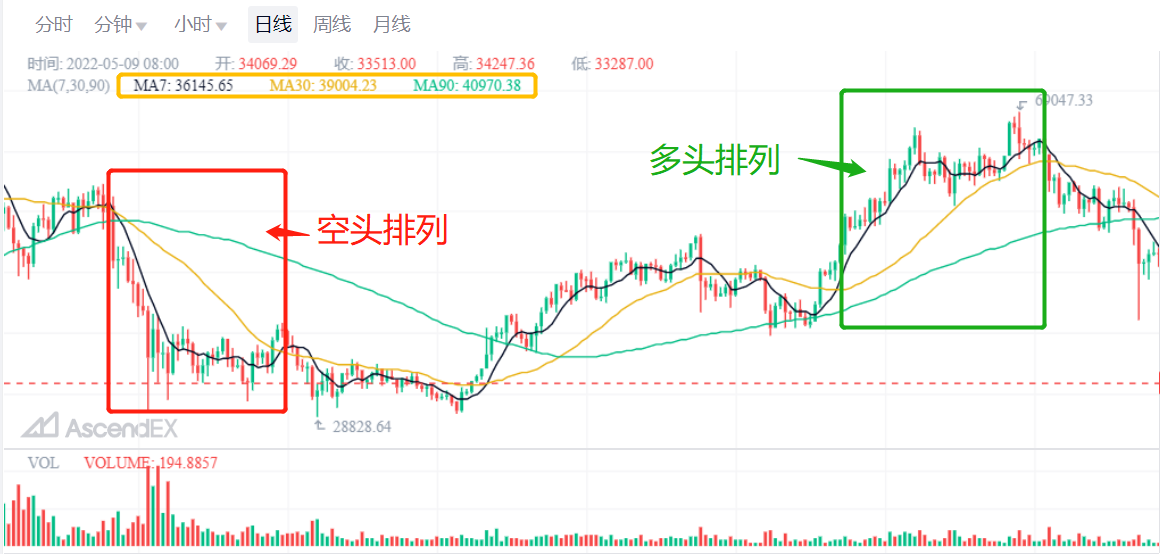
(3) Long arrangement and short arrangement
Short position arrangement means that the moving average positions are arranged in the chart from short to long moving average periods, and then arranged from bottom to top, that is, the short-term average price is lower than the long-term average price, and at the same time, the entire average system presents a downward divergence trend. This is a signal that the market is in a strong downtrend and traders can short rallies.
secondary title
Advantages and disadvantages of MA
The most basic advantage of MA is that it can play a role as a ruler to help traders distinguish the strength of the market. In practical applications, MA is mainly used to judge and predict the current and possible future trends of the market. At the same time, since the average value is taken for a period of time, the value is relatively smooth, which can help traders create easily identifiable trend indicators to assist in transaction analysis. At the same time, many technical analysis methods in the existing technical analysis field are extensions of the concept of moving averages, such as deviation rate, MACD indicator, Bollinger Road, etc.