secondary title
What is RSI?
RSI is the abbreviation of Relative Strength Index, often translated into Chinese as Relative Strength Index, which is one of the most widely used technical analysis indicators.
The RSI indicator was created by Welles Wilder (Welles Wilder), and was first published in the American Commodities magazine (now Future magazine) in June 1978. Subsequently, the indicator was included in Wilde's book "New Concepts in Technical Trading Systems" published in the same year. Since the calculation of this indicator is simple and easy to understand, it has been widely disseminated once it was launched.
At the same time, the RSI indicator can also reflect the strength of buyers and sellers in the market at different time points. Or from the perspective of price alone, it can also be said that RSI can reflect the cleanliness of the rising and falling trend of prices. The stronger the bullish or bearish power, the cleaner the trend, and the more extreme (extremely large or extremely small) the corresponding indicator value.
secondary title
RSI calculation formula
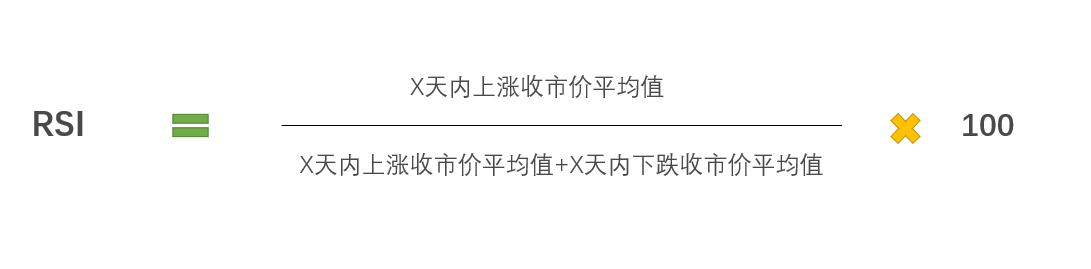
RSI is calculated by the average increase and decrease of prices within a selected period of time. In other words, it uses the strength of buyers and sellers to calculate the equilibrium point to judge the future trend of prices within a period of time. The specific calculation formula is as follows:
The average closing price increase within X days = the sum of the closing price increases within X days/X
The average value of closing prices falling within X days = the sum of the closing price declines within X days/X
For ease of understanding, take BTC as an example to calculate the RSI value for the selected time of 14 days. Suppose, in these 14 days, there are 9 days when BTC is rising, and the cumulative increase is 28%. That is 7%÷14 = 0.5%; then RSI = 1% / (1%+0.5%) × 100 = 66.7.
Of course, the above calculation is only used as an example to assist in understanding the RSI calculation process. In the actual market analysis, almost all the market charts of various platforms have their own analysis indicator functions, and investors only need to check and use them directly.
According to its calculation formula, the size range of the RSI indicator is 0 to 100, and 50 is generally regarded as the boundary between long and short:RSI value > 50:
The average increase in price over the selected period is greater than the average decrease, indicating strong buying power.<50:RSI value
At the same time, a larger RSI value means a stronger upward trend; conversely, a smaller RSI value means a stronger downward trend; and if the RSI value hovers around 50, it means that the market is temporarily unclear about the direction of long and short. Even though asset prices fluctuate greatly at this time, in fact, the cumulative price rises and falls are quite the same.
secondary title
How to use RSI indicator to assist analysis?
RSI represents the strength and weakness of price movements in the past period of time, so investors often use it to assess the timing of entering and exiting the market. In its practical application, it is mainly based on the contrarian view, that is, if the rise and fall are too extreme, the price will return to the average within a period of time.
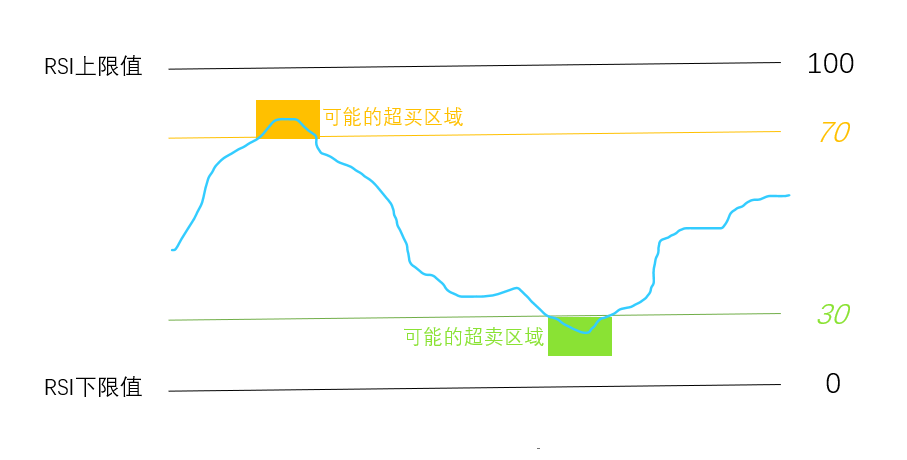
RSI>Based on this, in the value range of RSI [0~100], 70 and 30 are commonly used as the basis for analysis and judgment. The specific performance is:
70: Indicates that the price is rising rapidly, and the market may be overbought. At this time, it is necessary to evaluate that the trend may reverse downward. If the rise is weak, look for selling opportunities at this time.
When 70 and 30 are used as the reference point of the RSI indicator, its time preset value is generally 14 days. Since the change range of the RSI indicator will increase as its time span shrinks, in other words, the 14-day RSI is more sensitive to prices than the 9-day RSI. Therefore, for RSI indicators with a short time span, 80 and 20 are usually used instead of 70 and 30 as analysis references. At the same time, since RSI will drift in bull and bear markets, 80 and 20 are more often regarded as the reference basis for overbought and oversold levels in bull markets.
secondary title
RSI divergence
The change of RSI trend and the trend of asset price will not be consistent forever. When there is inconsistency, this situation is called RSI divergence. Divergence, also known as a drawdown, occurs when the RSI exceeds 70 and falls below 30. RSI divergence is seen as the most indicative feature of the RSI indicator.
Divergence is divided into top divergence and bottom divergence.
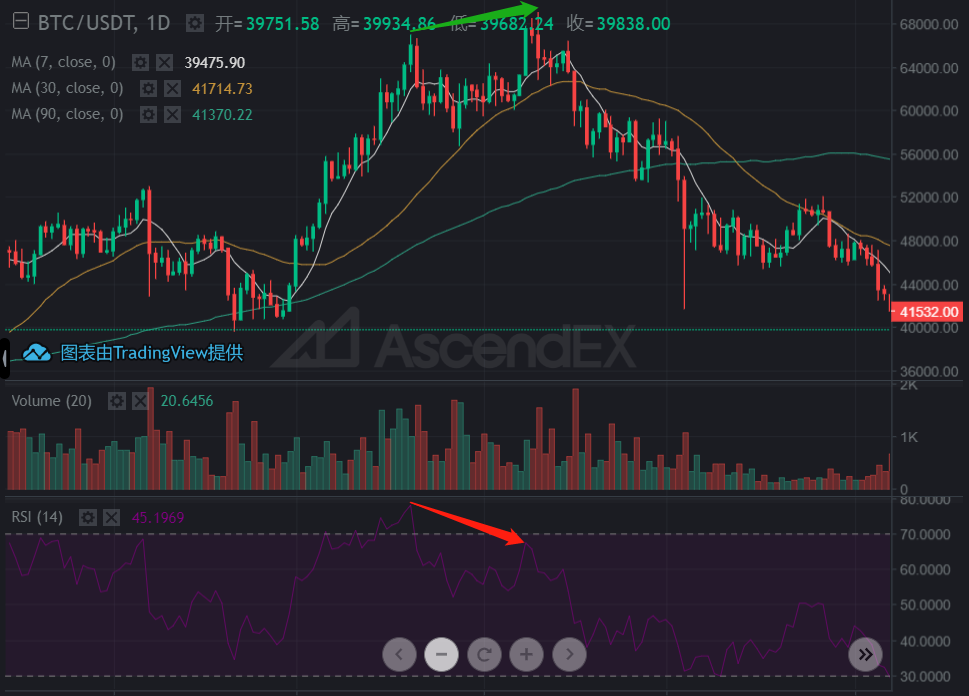
The top divergence is also called bearish divergence (Bearish RSI Divergence), which means that in an upward trend, the new peak of RSI (the premise that RSI has exceeded 70) is unable to exceed the previous peak, and then falls below the previous trough. The simple understanding is that the price has reached a new high, but the RSI value has gone down during the same period, which means that the rise is weaker than before.
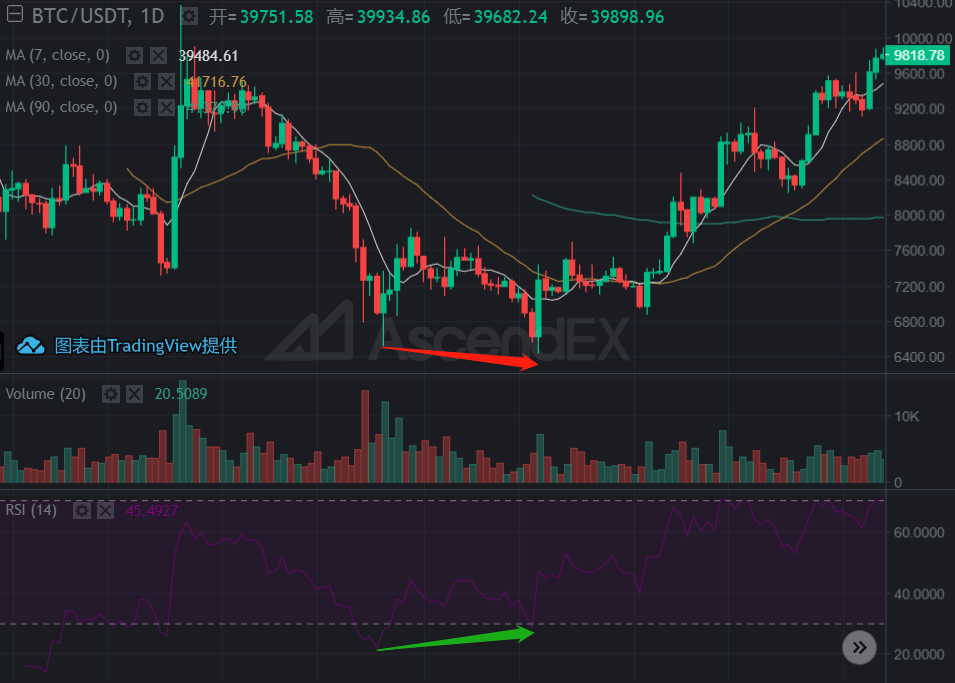
However, it should be noted that in a market environment with strong trends, the RSI divergence indicator may not be as safe and reliable as expected. For example, a strong downtrend can result in multiple bullish divergences before eventually reaching an actual bottom. Therefore, RSI divergence is more suitable for less volatile markets.
secondary title
Limitations of the RSI indicator
Like all other technical analysis indicators, RSI is not a universal indicator of technical analysis, and it also has many limitations.
1. RSI only reflects the price situation for a whole period of time in the past, and does not consider the actual sequence of rise and fall.
2. RSI has no smoothness, and its changes mainly reflect the latest price addition or removal. For example, the cumulative price change in 14 days may cause violent fluctuations in the RSI index due to the sharp rise and fall of the newly added price.
3. Since RSI does not consider time sequence, RSI with a long time span can only be used to evaluate the situation in the past period of time, and it does not make much sense as a reference for predicting the future.
4. RSI only reflects the price changes in a certain period of time, and cannot show the changes in longer trends. Therefore, if we only use the short-term long-short strength as the basis, we may misjudge the future.
5. If the market trend is too consistent in the short term, such as continuous rise or fall, it will lead to the problem of RSI passivation, that is, the comparison between rise and fall at this time will lose meaning, and it is difficult to reflect the actual price changes. The specific performance is that the RSI value stays in the extreme area for a long time, even close to 100 and 0.