Original source:Nansen
Original source:
Authors: Darren Lim, Javier Gonzalez, Louisa ChoeAmong the NFTs that have been minted, one-third of the floor price is higher than its initial minting cost. Likewise, a third of all NFTs end up rotten in hands, with little to no trading activity after minting.
Understand the NFT market through the actions of NFT Minter
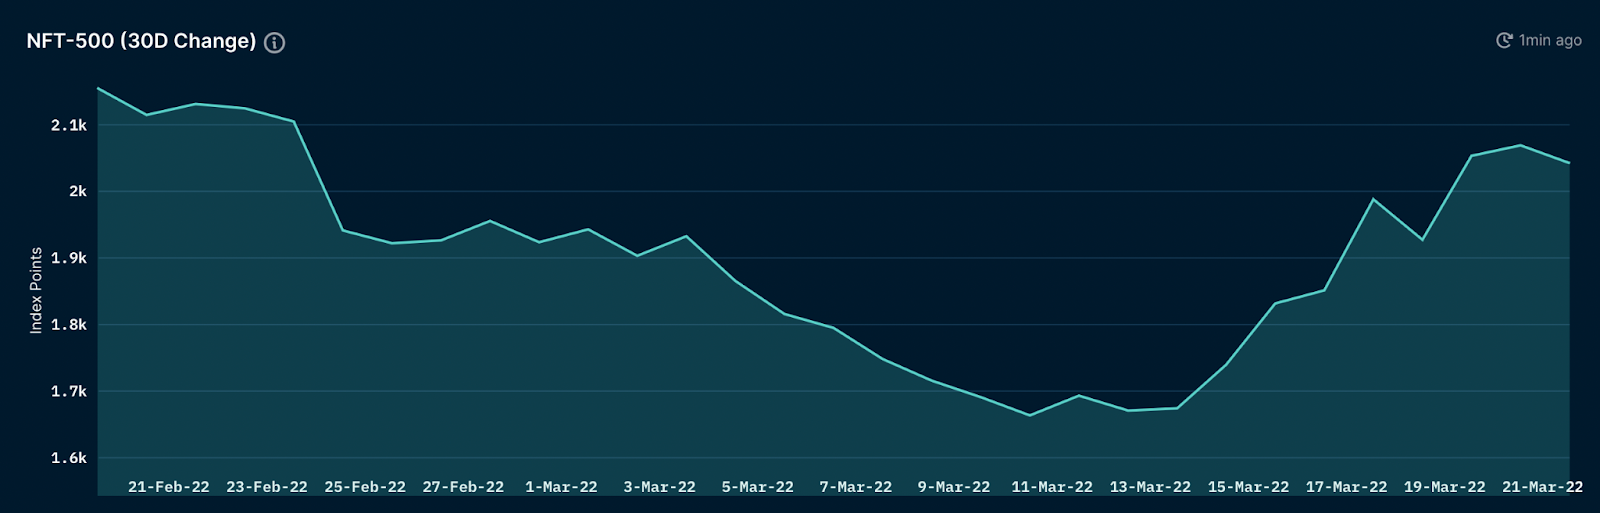
(NFT market trend in the past 30 days: February 20 to March 21)
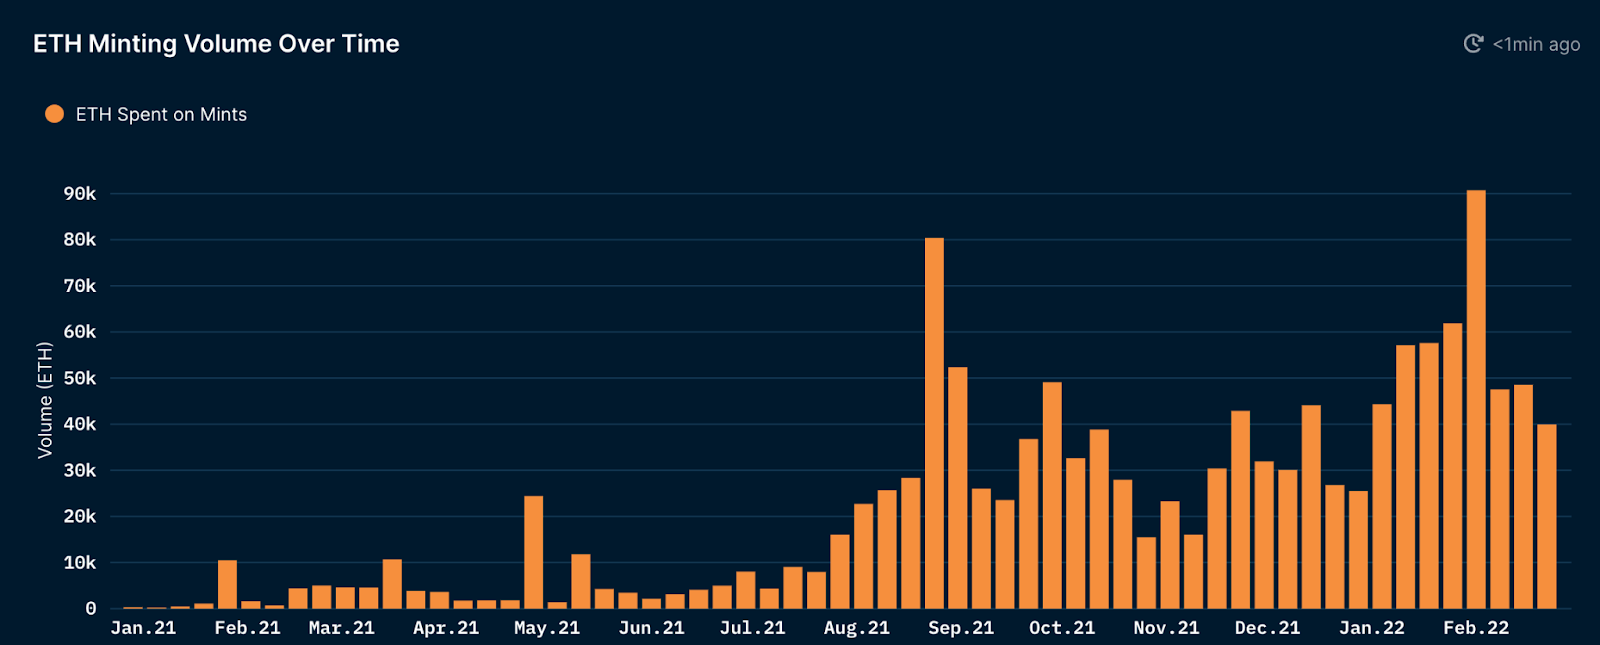
image description
Over the past 30 days, we have seen a slight correction in the NFT market, with the Nansen NFT-500 (ETH) Index down 5.23% in ETH terms and 0.89% in USD terms. This movement is in line with the overall trend of the market: the market expects higher interest rates and a war between Russia and Ukraine, and the market sentiment is mainly risk-off. This sentiment is also reflected in minting volume, which has declined over the past 30 days. Although the Nansen NFT-500 Index reflects this market sentiment, we can also observe this trend through the behavior of NFT Minters.

image description
Since 2022, the ETH spent on minting NFTs is gradually decreasing. Comparing this trend with Google Trends, we can see that searches for NFTs are also declining, which indicates that interest in NFTs may slow down in the short term.
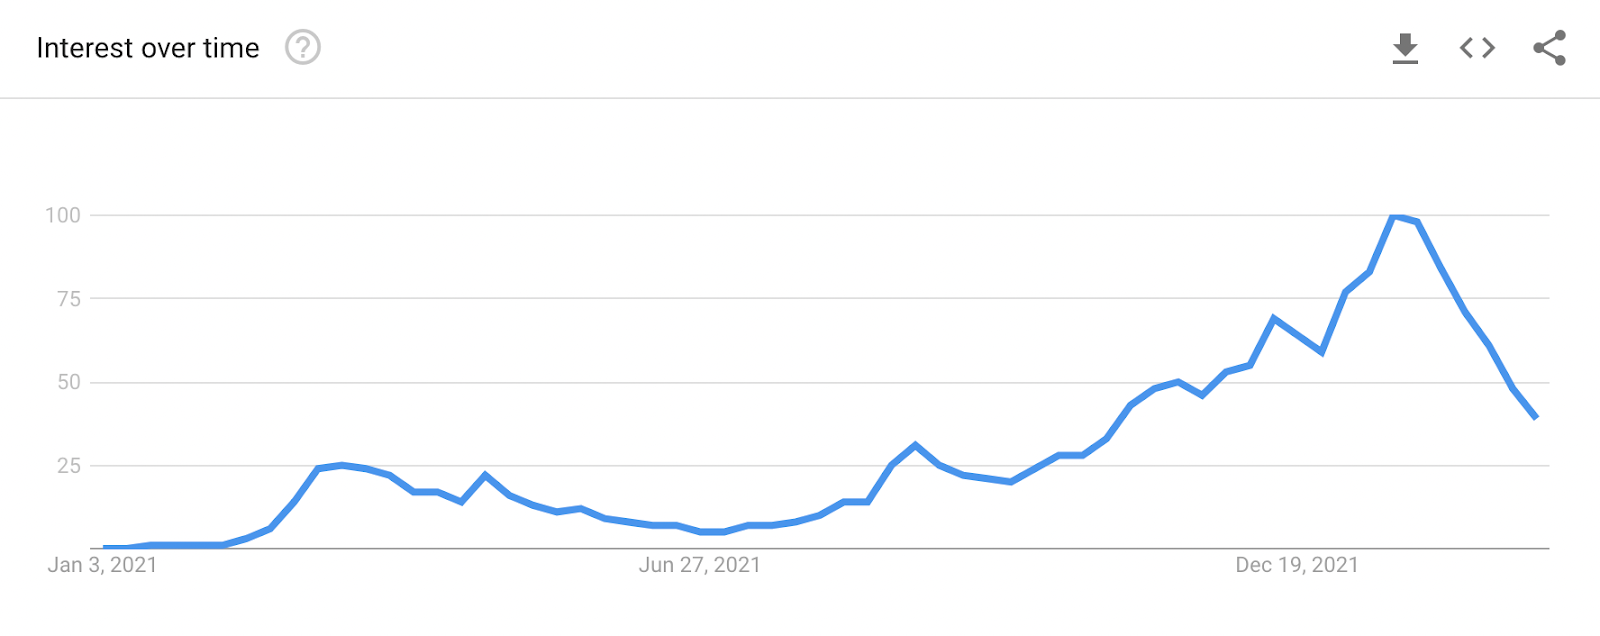
image description
However, we noticed that NFT Minter spent more ETH on minting and gas this year compared to the previous year (2021). During this time, there have been some well-known NFT mints, including MAYC, Pixelmon, Meebit, and Lost Poets:
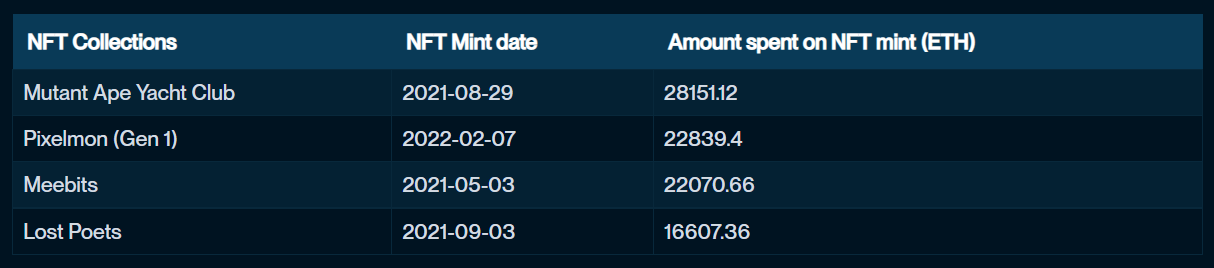
(From left to right, the table shows the name of the NFT collection, the time of NFT minting, and the ETH cost of NFT minting)
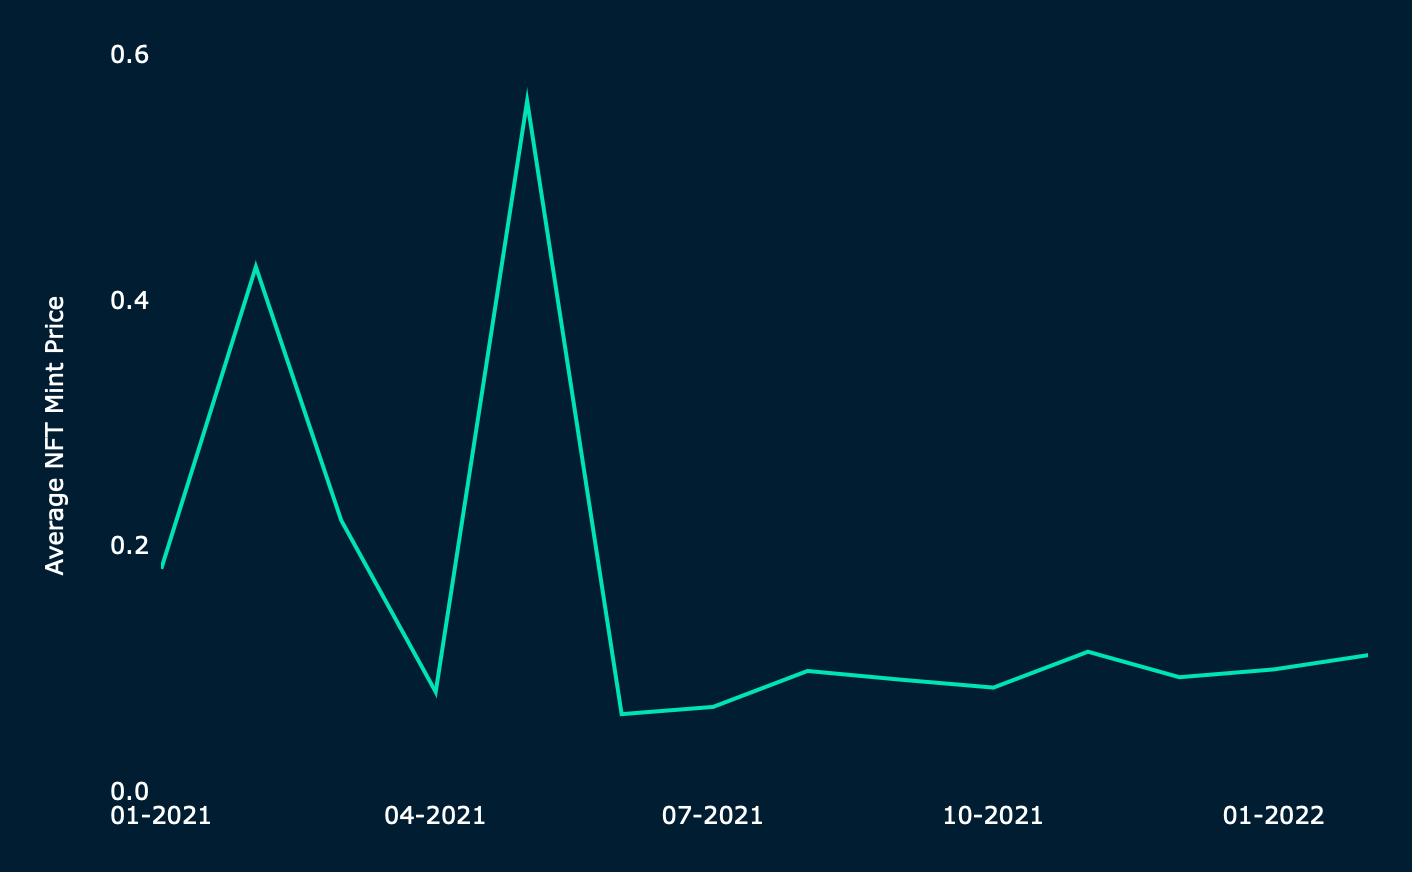
image description
Further research data shows that the average minting cost peaked at 0.56 ETH in May 2021, but fell to a low of 0.06 ETH in June 2021. Since July 2021, the average minting cost of an NFT has been between 0.07 ETH and 0.1 ETH. We hypothesize that one possible explanation for this phenomenon is that as more projects are introduced into the market, competition for NFT minting increases, thereby driving average minting costs down. From January 2021 to February 2022, we see the number of mints increase by more than 4800%, from 39802 to 1970886.
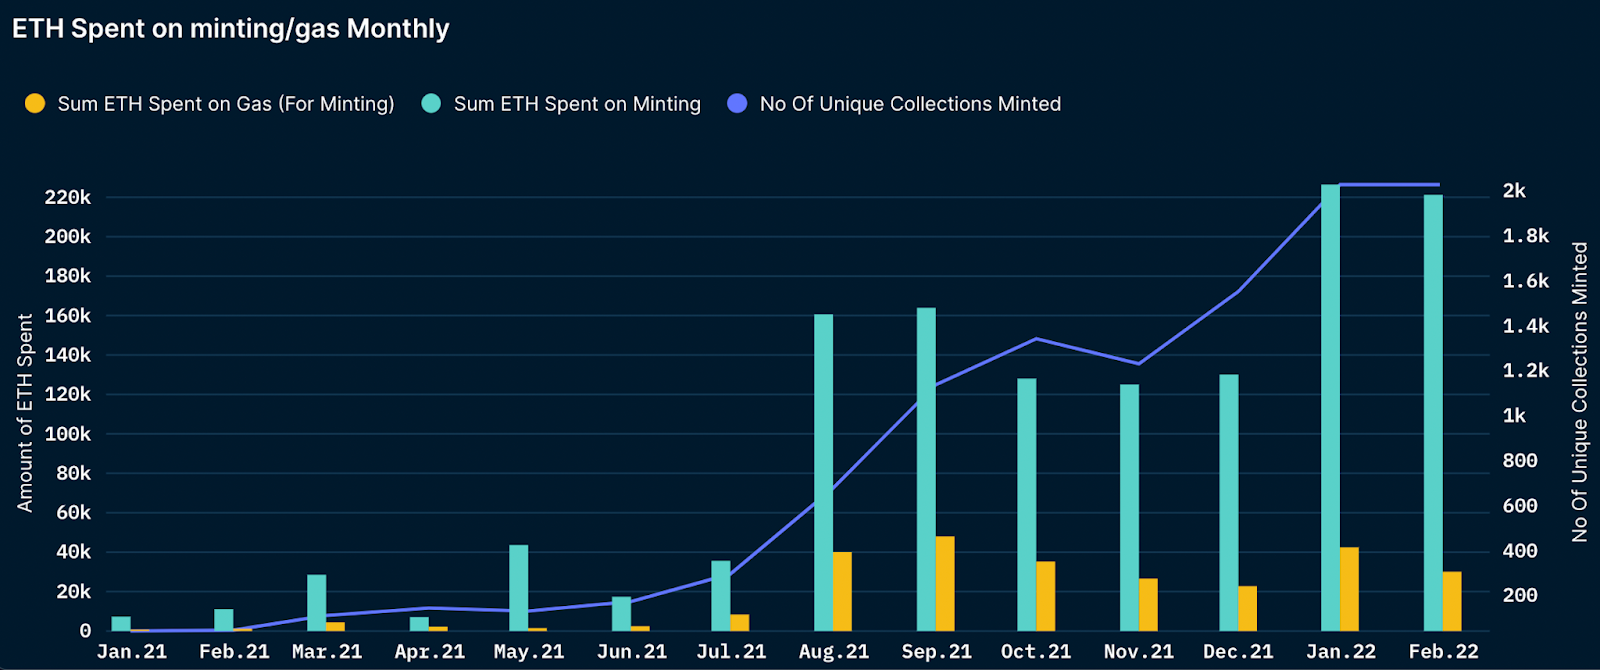
(Spend on NFT minting and number of unique collections minted)
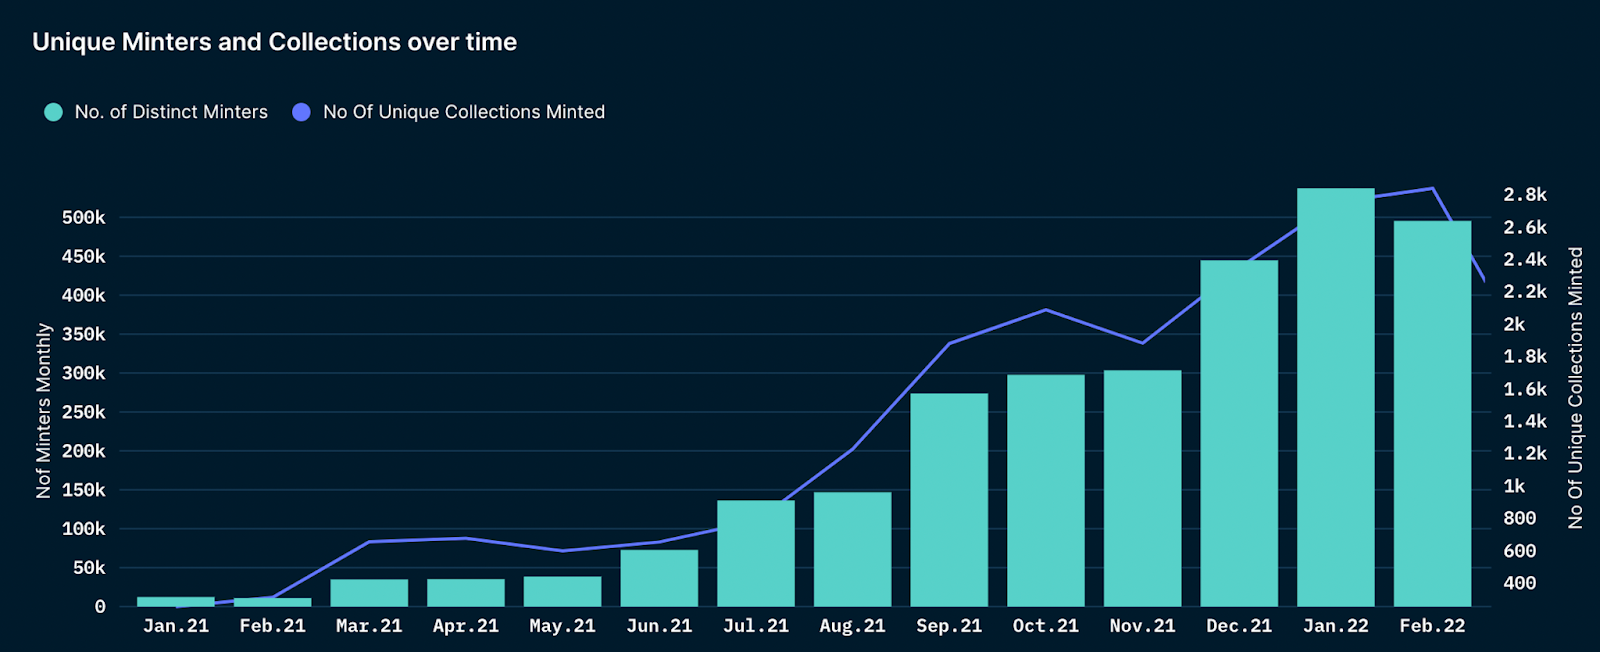
image description
The increase in NFT minting and total gas spend is likely due to the increasing number of independent NFT miners participating over time.
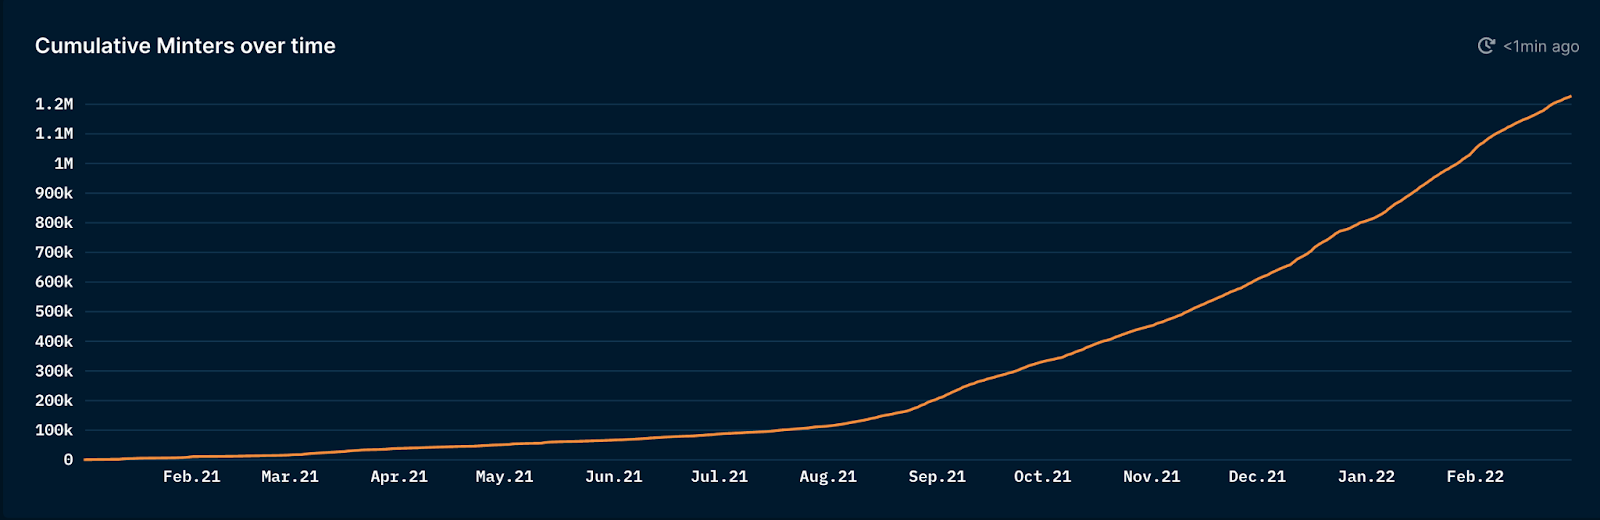
image description
(Accumulation of NFT Minter quantity)Between 2021 and 2022, the cumulative number of NFT miners in the NFT market has increased by 2,000 times, from about 500 in early 2021 to 1.2 million by the end of February 2022.
NFT Minter User Profile
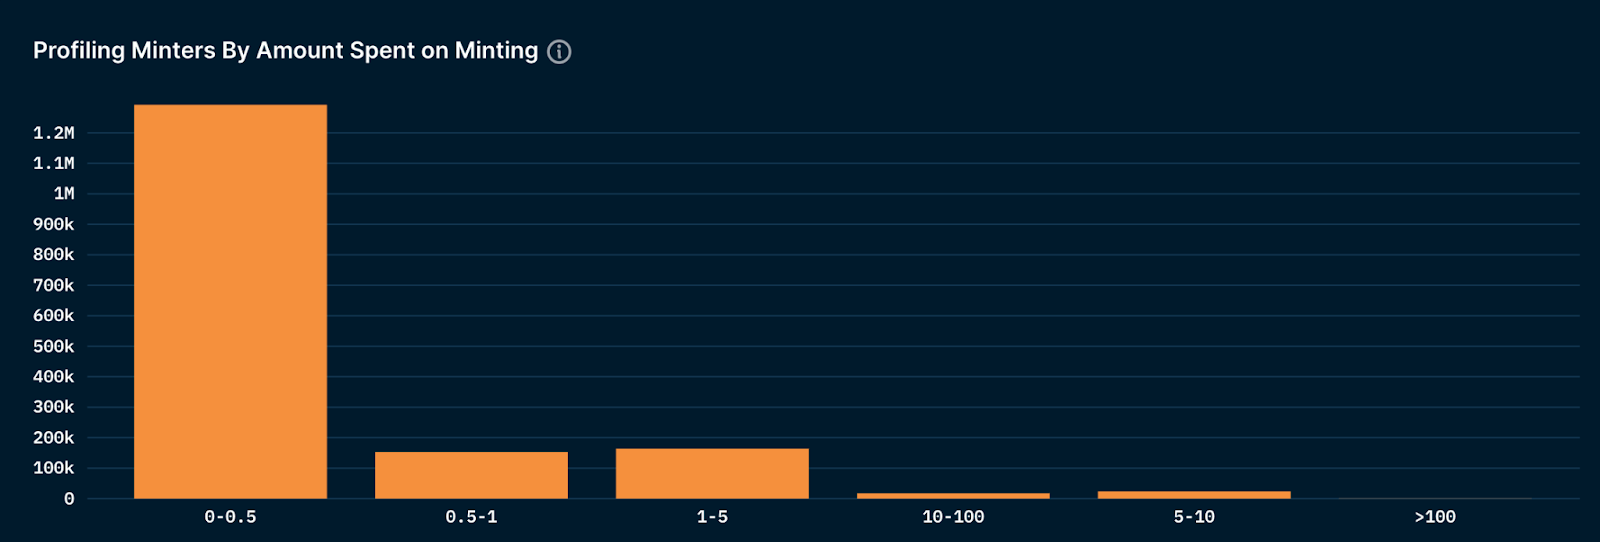
(NFT Minter's distribution of casting costs)
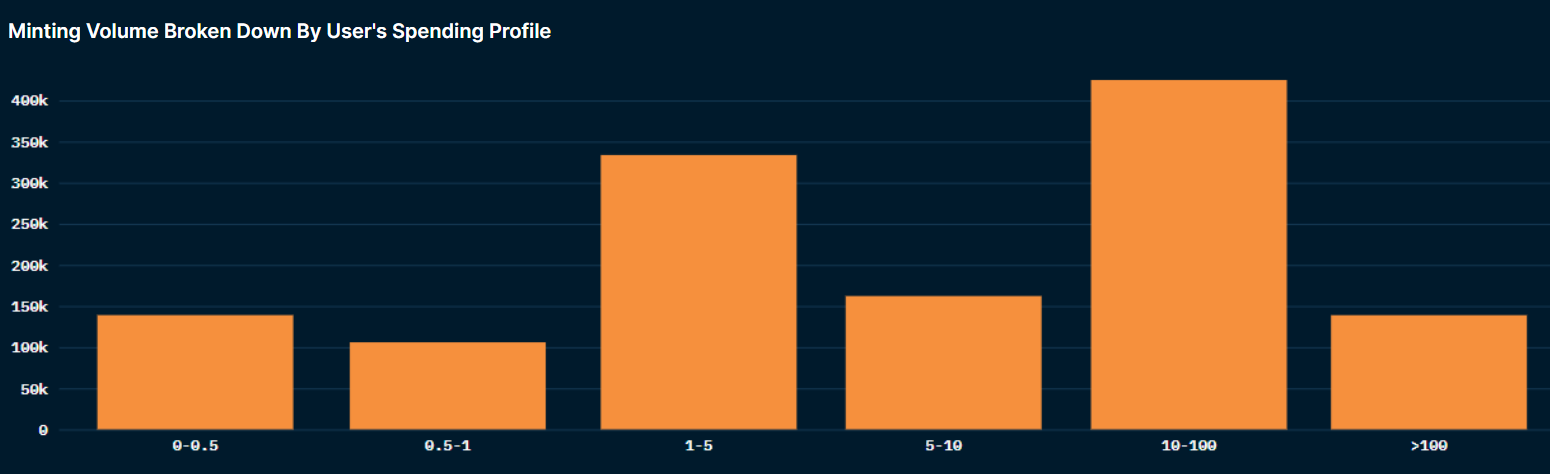
image description
(Amount of ETH spent on NFT minting collated by NFT Minter's spending)
The NFT miners that dominate the minted volume are those who spend 10 to 100 ETH, they account for about a third (32.6%) of the total minted volume.
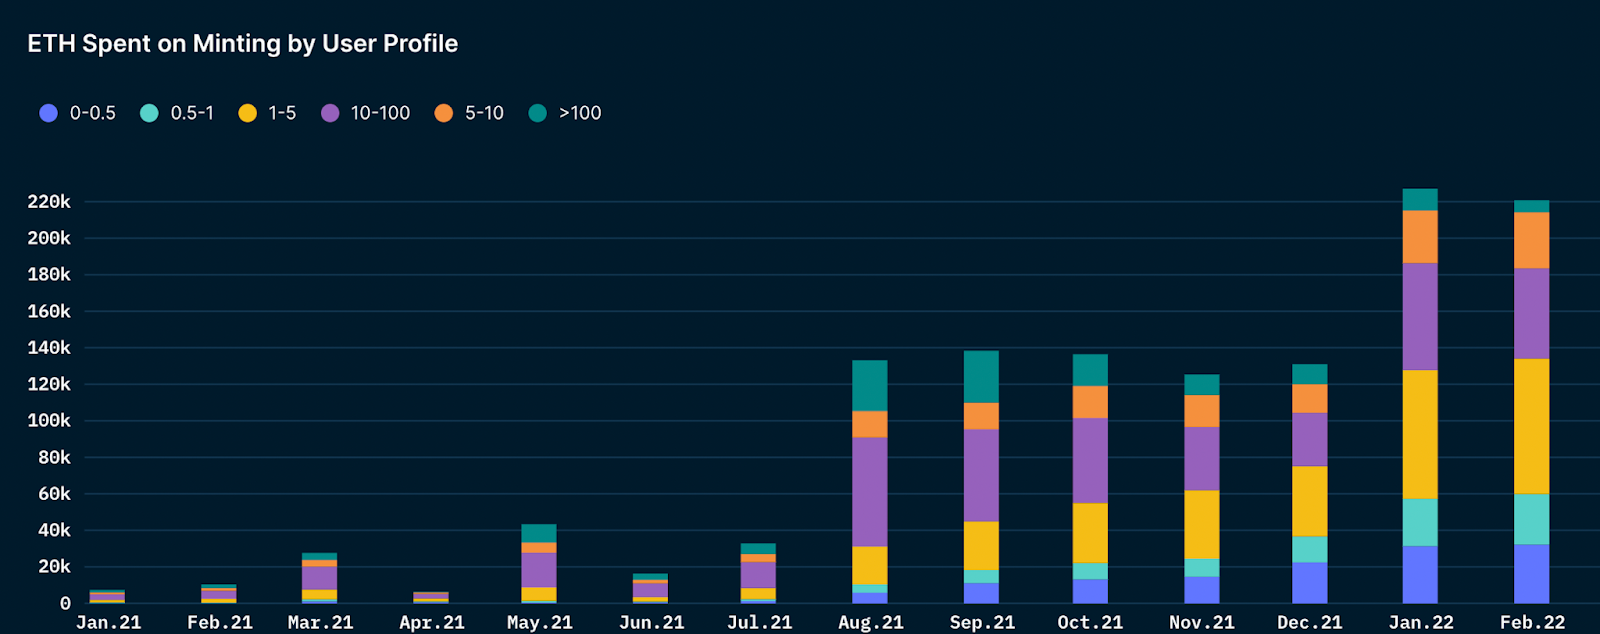
image description
When analyzing the basic situation of NFT Minter each month, we found that before 2022, the NFT Minter group that spent 10 to 100 ETH accounted for the largest proportion. However, since December 2021, this trend has reversed, with NFT Minters costing 1 to 5 ETH being the most representative. On the other hand, there appears to be a slight decrease in “whale” NFT minters spending over 100 ETH.
Minting does not mean earnings are guaranteed
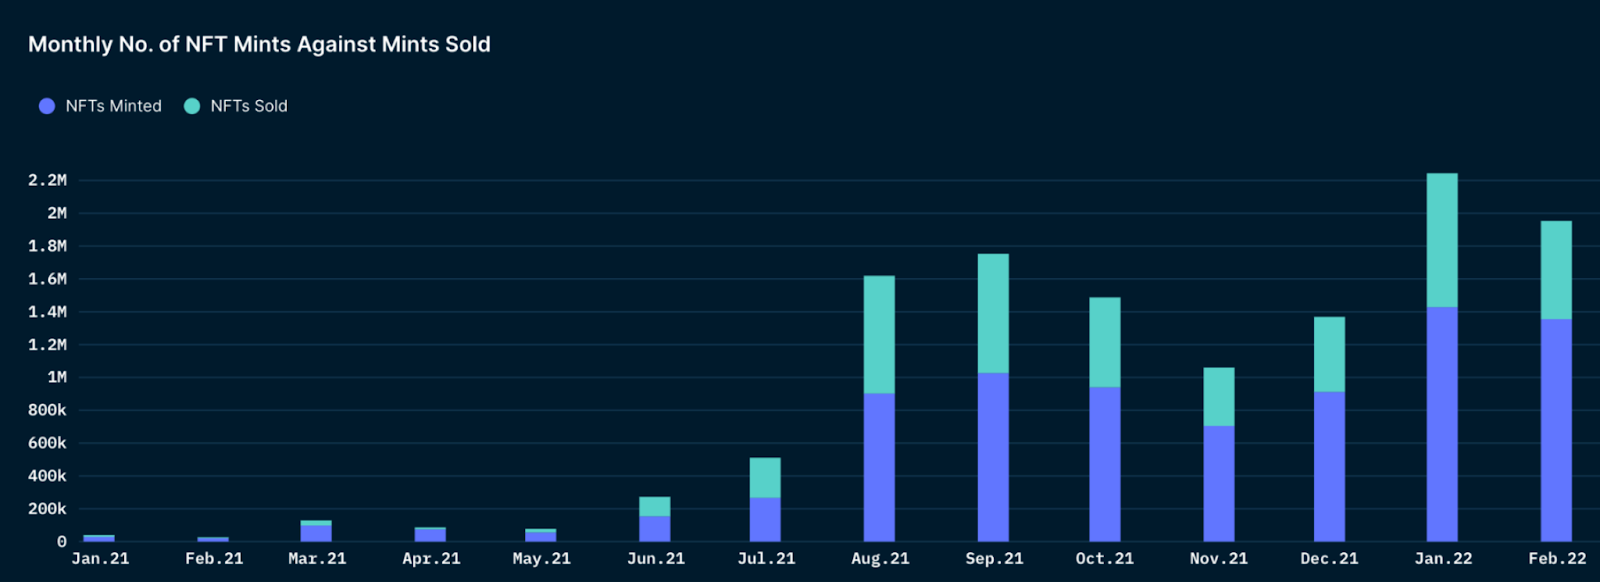
image description
(The dark side of minting NFTs - most NFTs are never sold)
However, starting from July 2021, the proportion of NFTs sold on the secondary market seems to be gradually decreasing.
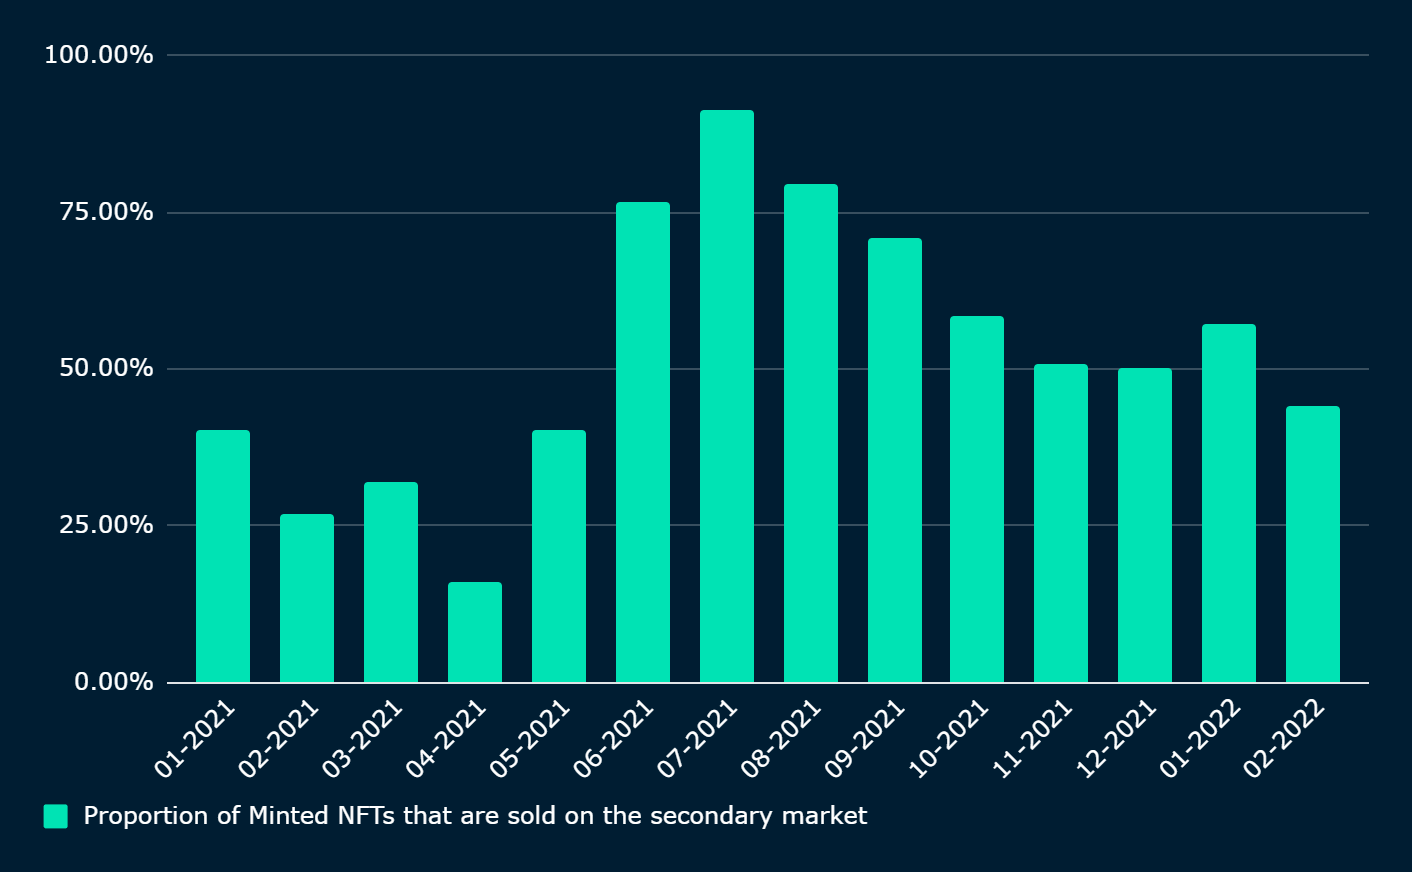
(Proportion of NFT traded in the secondary market)
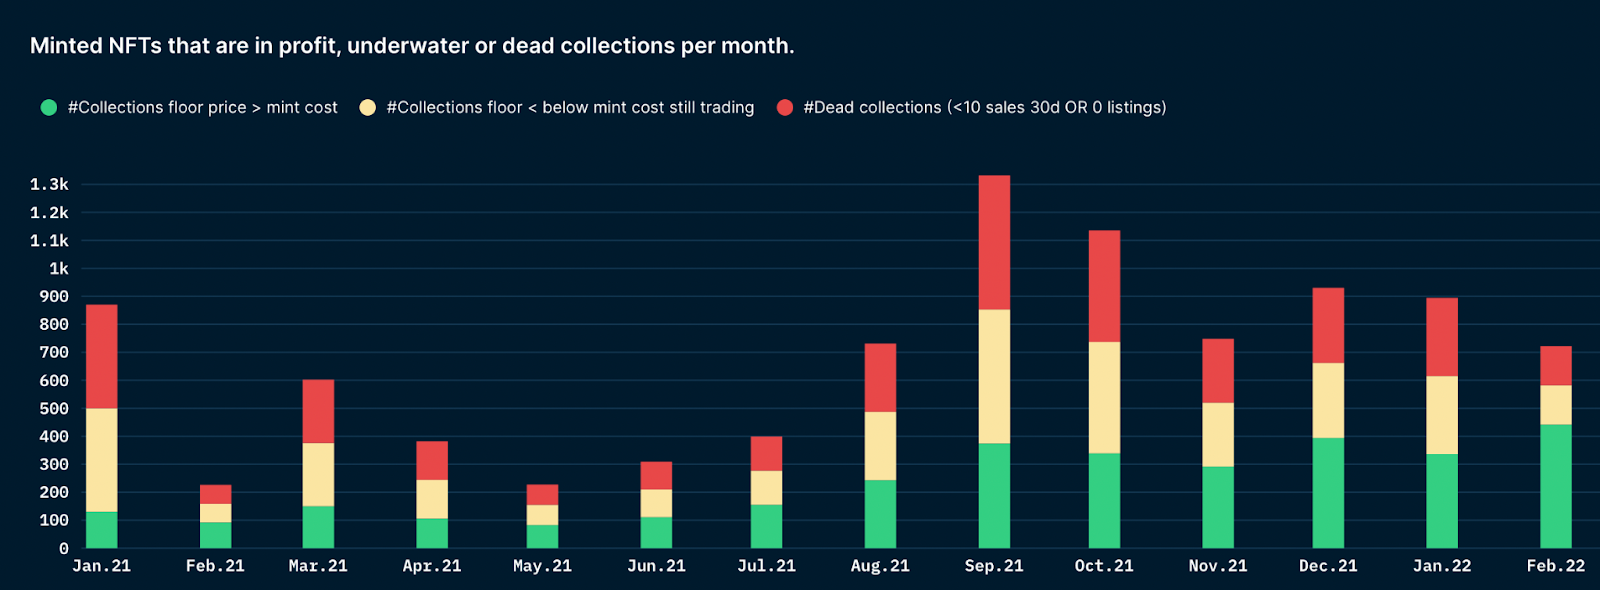
image description
(NFTs that are in profit, loss, or already in a "dead" state)When analyzing the profitability of minted NFTs, the report shows that, on average,One out of every three minted NFTs will become a "dead collection" (rotten in hands) with little to no trading activity.We have seen the proportion of NFTs that are profitable increase over time, while the proportion of NFTs that are bad is gradually decreasing.
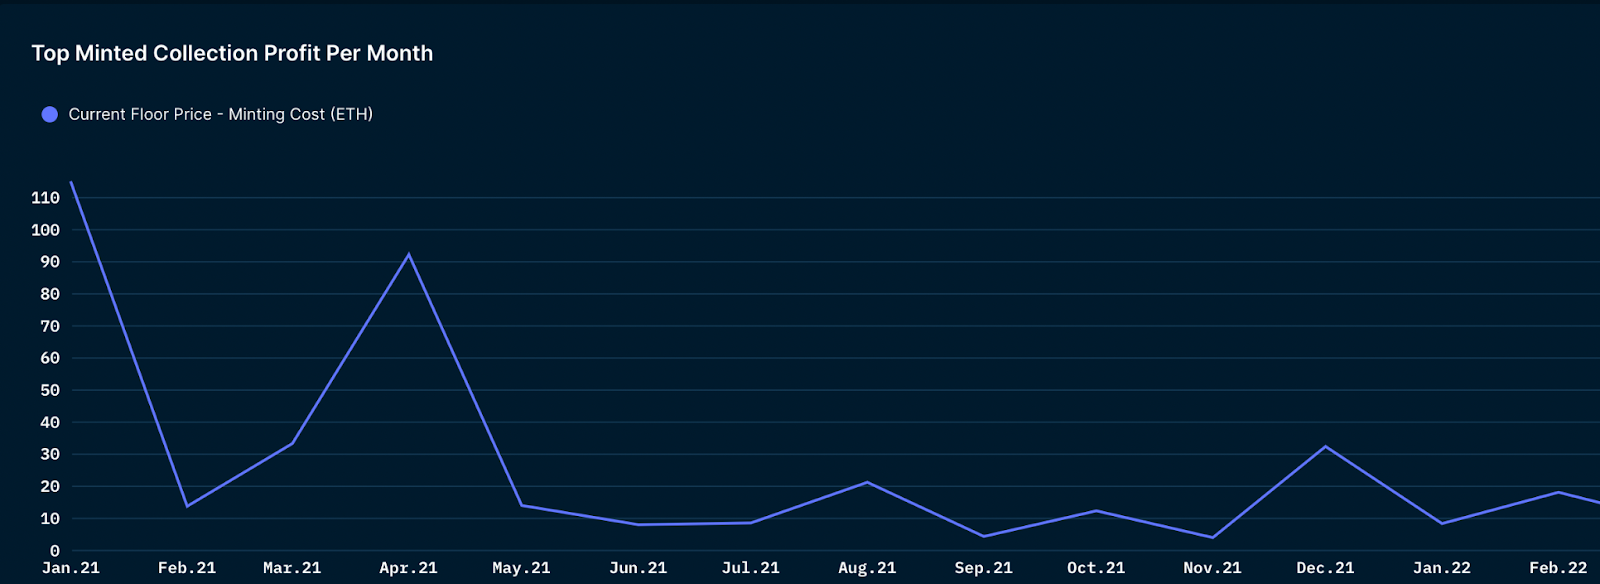
image description
What if the minted NFT was in good condition? (Profit from top collectibles minted monthly)
When we analyze the monthly profits of the top minted holdings, we can see that the smallest average profit is around 4 ETH, with a peak of 115 ETH. As the graph above shows, the profit trajectory of top favorites is volatile.
Bottom line: what kind of NFT should we mint?