Original source: Nansen
first level title
Original Compilation: Mary Liu
This article is from BitpushNews.
foreword
Designed to measure active strategies when investing in the NFT market, the Nansen NFT Index sets the base index for investors seeking to track an index representative of the market or a specific segment. Alternatively, these indices serve as a mechanism to measure the performance of the NFT market over time. The purpose of this research article is threefold: Part I identifies why investors seek NFT exposure and how they do so through the NFT Index; Part II provides an overview of the Nansen NFT Index; implied market trends.
first level title
Provide investors with NFT exposure through indices
Applying this to the NFT market, Nansen designed a set of indices consisting of different collections of NFTs representing different NFT market segments such as social, gaming, art, and metaverse. Investors can follow different market indices to gauge market movements and performance.
first level title
Nansen NFT Index
Nansen NFT Indices allow investors to track specific NFT market segments, and these indices serve as a mechanism to measure the performance of the NFT market over time. For markets to be included in a market benchmark index, they must meet certain eligibility criteria.
Nansen NFT-500
This group of indexes adopts a market capitalization weighted strategy, and the market capitalization is denominated in Ethereum (ETH). The Nansen NFT index portfolio includes:
Nansen Blue Chip 10
Nansen Social - 100
Nansen Game - 50
Nansen Metaverse - 20
Nansen NFT-500
secondary title
The NFT-500 Index is calculated daily and rebalanced every 30 days, where the index components are re-evaluated and rebalanced accordingly.
secondary title
Nansen Blue Chip 10
The Blue Chip-10 Index is calculated daily and rebalanced every 90 days, where the index components are re-evaluated and rebalanced accordingly.
secondary title
Nansen Social - 100
The Social-100 NFTs Index is calculated daily and rebalanced every 30 days, where the index components are re-evaluated and rebalanced accordingly.
secondary title
Gaming NFT collectibles are the fastest growing segment of the NFT market. The Gaming NFTs Index consists of a collection of 50 NFTs further divided into subcategories: Play-to-Earn (P2E) Games, Role-Playing Games (RPG), DeFi-related Games (GameFi).
secondary title
Nansen Art-20
For example, XCOPY's "TRAITORS" series is a form of digital art, which some might consider new media art, in which artists create works using computers or electronic devices. Generative art, on the other hand, is a derivative form of digital art that often involves the use of programming in its creation, an example being Autoglyphs. Then there are physical works of art, such as the work of FEWOCiOUS. Finally, music is also classified as part of NFT art.
secondary title
Another growing momentum in the NFT market is Metaverse. The Metaverse NFTs Index consists of 20 collections of NFTs further divided into subcategories: Land & Real Estate, Avatars, Assets, and Utilities.
Market Trends with Nansen NFT Index
text
1. The NFT market outperformed the crypto market with a 68.5% year-to-date (YTD) performance
While most markets have corrected year-to-date, the NFT market has been outperforming the cryptocurrency market, with ETH-denominated NFT markets performing 68.5% YTD and USD-denominated 20.9% YTD. In terms of the cryptocurrency market, according to Bitui terminal data, since January 1, 2022, Bitcoin has fallen by about 17%, and Ethereum has fallen by more than 31%.
However, over the past 30 days (as of March 9, 2022), the NFT market has undergone a correction, falling -28.8% when denominated in ETH and -38.5% when denominated in USD.
2. NFT is inversely proportional to DeFi
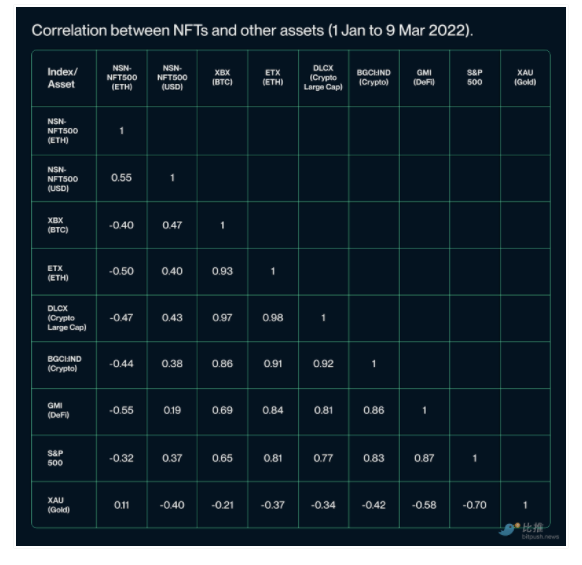
Correlation between NFTs and other assets (January 1-March 9, 2022):
Year-to-date, the Nansen NFT-500 (ETH) Index is negatively correlated with the cryptocurrency market. The chart above shows that the NFT 500 Index (denominated in ETH) has a correlation coefficient of -0.46 with Bitcoin. The same index has a -0.6 correlation with Ethereum (also denominated in ETH). However, when the index is denominated in USD (Nansen NFT-500 (USD)), the correlation with the cryptocurrency market appears to be positive, albeit relatively weak. The inverse relationship between ETH-denominated NFTs and the decentralized finance (DeFi) cryptocurrency space is slightly more pronounced.
When measuring the correlation coefficient, a "1" indicates a direct positive correlation, which means that the two variables are perfectly converging. Conversely, "-1" indicates that the two variables are moving in opposite directions.
The main reason for this difference is volatility. Nansen Research Analyst Louisa Choe said: "When NFTs are denominated in US dollars, they also perform very differently. This is due to fluctuations in the ETH/USD exchange rate. Therefore, the resulting correlation coefficients are also different. This may be investors. An important factor in deciding whether the denomination of their portfolio should be cryptocurrency or fiat.”
3. Shiba Inu is more volatile than NFT YTD
When analyzing the volatility of the NFT market using the Nansen NFT-500 (ETH) and NFT-500 (USD) indices, we observed that (meme coin) Shiba Inu was more volatile than NFT YTD. Additionally, when exploring Ethereum's historical price volatility, Ethereum's price action in 2016 appears to have been more volatile than the current NFT market. And in 2018, Ethereum’s volatility was similar to that of the Nansen NFT-500 (USD Index). Importantly, however, the data points used to calculate YTD volatility may not be sufficient to draw concrete conclusions.
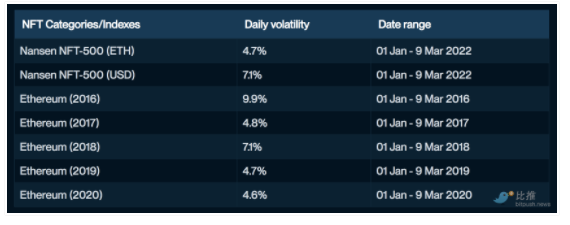
Daily volatility comparison of NFTs with other cryptocurrencies:
4. Social NFT leads the NFT market YTD
The market cap of social NFTs is estimated at $9.5 billion (3.57 million ETH), accounting for roughly 79% of the NFT market cap. The performance of the index highlights the benefits of diversification when investing in social NFTs such as profile pictures. For social NFTs, we observe that brand recognition and perception building of NFTs are important factors driving their performance.
As of March 9, 2022, the Nansen Art NFT Index has returned 30.8% (in ETH) and -6.1% (in USD). During the same period, the Social-100 Index returned 93.7% (in ETH terms) and 39% (in USD terms).
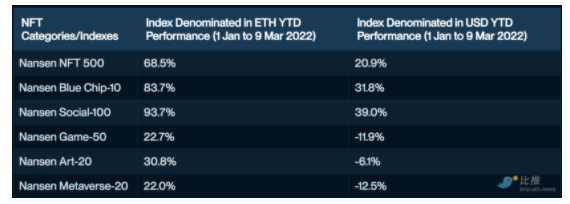
Performance of different NFT categories:
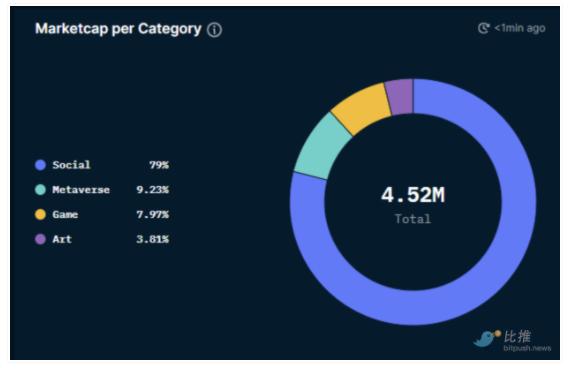
Market cap of different NFT classes (denominated in ETH):
5. Metaverse and game NFTs are the least volatile, while blue chips and art NFTs are the most volatile YTD
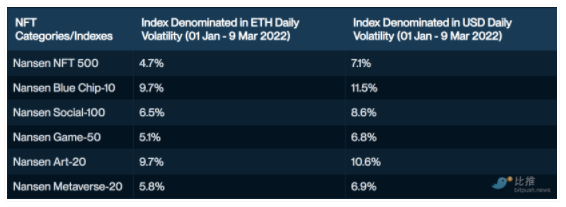
Daily volatility for different NFT categories:
Volatility varies between NFT categories. The performance of the index shows that metaverse and gaming NFTs are the least volatile year-to-date, while blue-chip and art NFTs have been the most volatile over the period.
Specifically, the daily volatility of art NFT is 36% (ETH) and 37.3% (USD), and the volatility of metaverse and social tokens is the smallest, far below 10%.