There has always been a saying in the public chain track - "The period before the official landing of ETH 2.0 is the last window period for all new-generation public chains."
Take a closer look at this sentence. Although the attributive is the landing of ETH 2.0, what I actually want to say is whether Ethereum can break through the performance shackles and achieve expansion. However, looking at the expansion of Ethereum, in addition to the horizontal sharding of ETH 2.0, there is also a vertical layered Layer 2. With the explosive growth of the Polygon ecosystem and the launch of Arbitrum's mainnet, the popularity of the Layer2 track is rising rapidly, and more and more users are gradually realizing that the era of Layer2 is really coming.
first level title
Data comparison: Layer2 vs external public chain
As of the publication, there is only Polygon (Arbitrum has not yet been fully opened to users) in the ecology of the Layer 2 track. Although the community has some disputes about whether the side chain expansion solution mainly adopted by Polygon belongs to Layer 2, considering that Polygon has It provides (Plasma) and is exploring more expansion technology directions (Rollup). It is obviously more unreasonable to kick it out of the Layer2 track. Therefore, in the following, we will still regard Polygon as a representative project of the Layer2 track to compare with some of the most Representative public chains for data comparison.
Of course, the choice of representative projects for the public chain track also depends on the ecology. From the current point of view, the public chains of exchanges such as BSC and the new generation of high-performance public chains such as Solana and Fantom have accumulated a certain ecological scale, so the following will be based on These three items are representative and compared with Polygon from multiple data dimensions.
Before the comparison, we first need to declare a point:Compared with Layer 1 of Ethereum, both Layer 2 and the external public chain are still in the early stage, and the number of samples (projects) available for comparison is small, and the differences in the development stages of each project will also have a greater impact on the specific data status. Therefore, the results shown in the comparison are only the differences in the individual development trends of the samples, and cannot fully represent the differences in the development trends of the entire track.secondary title
Comparison Dimension 1: The Fluctuation of Locked Volume (TVL)
The growth trend of the total lock-up volume (TVL) is the best standard for judging the ecological development trend on the chain. However, after the 519 black swan incident, the encryption market suffered a serious setback. Almost all ecological TVLs have experienced varying degrees of decline. It is not realistic to talk about the growth trend. Therefore, the first comparison dimension we choose will be the TVL fluctuations of different ecology. Specifically, it is to look at the decline rate of the current TVL data of a certain ecology compared with historical highs.
1. Polygon
Let’s take a look at Polygon first. Considering that there are differences in details between different data aggregation platforms, Polygon, BSC, and Fantom will all use DeBank’s data when selecting data sources.
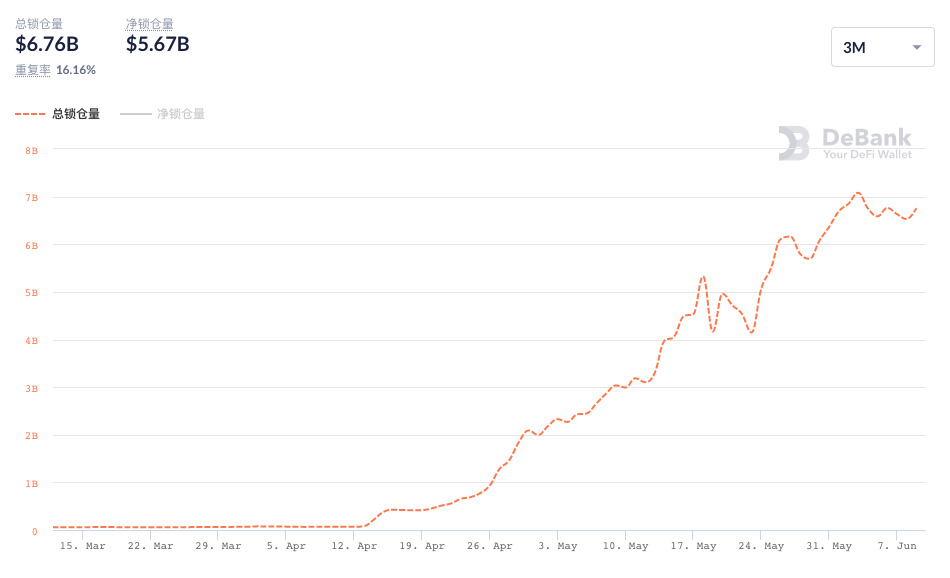
The TVL of all major ecosystems has almost declined due to the impact of the 519 black swan, and only a few stronger ecosystems have not been greatly affected by the event. Polygon is one of the lucky few.
The data shows that the overall growth trend of Polygon's TVL has not been disrupted by this round of market downturn at all. The historical peak of TVL was 7.08 billion US dollars on June 3, and the current (June 10) TVL data is 6.76 billion US dollars. The decline was only 4.5%.
2. Solana
Since DeBank has not yet included Solana, the data source of Solana ecology has chosenDefi Llama。
As can be clearly seen from the figure above, the fluctuation trend of Solana’s TVL data is in stark contrast to Polygon’s. The 519 black swan incident obviously had a greater impact on the overall lock-up level of the ecosystem.
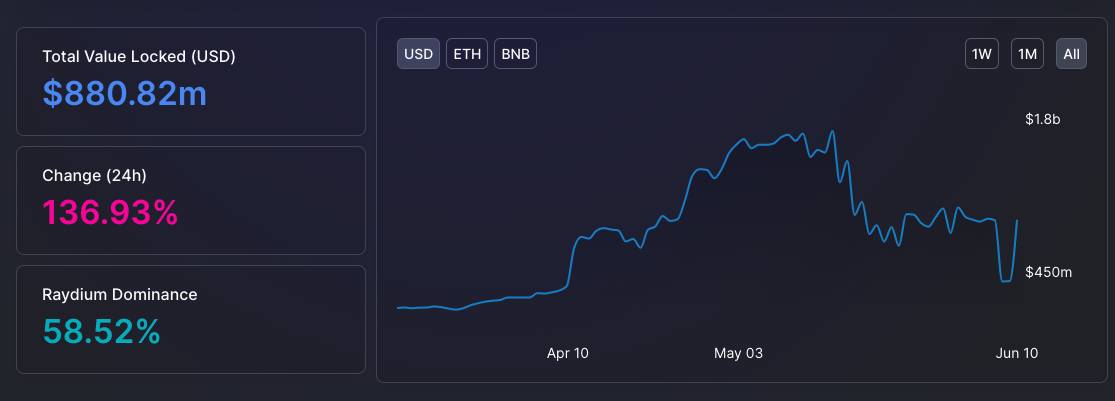
The data shows that Solana's current (June 10) TVL data is US$881 million, a 45.6% decline from the historical high of US$1.62 billion on May 16.
3. BSC
Just looking at the TVL trend after mid-May, the situation of BSC is closer to Solana.
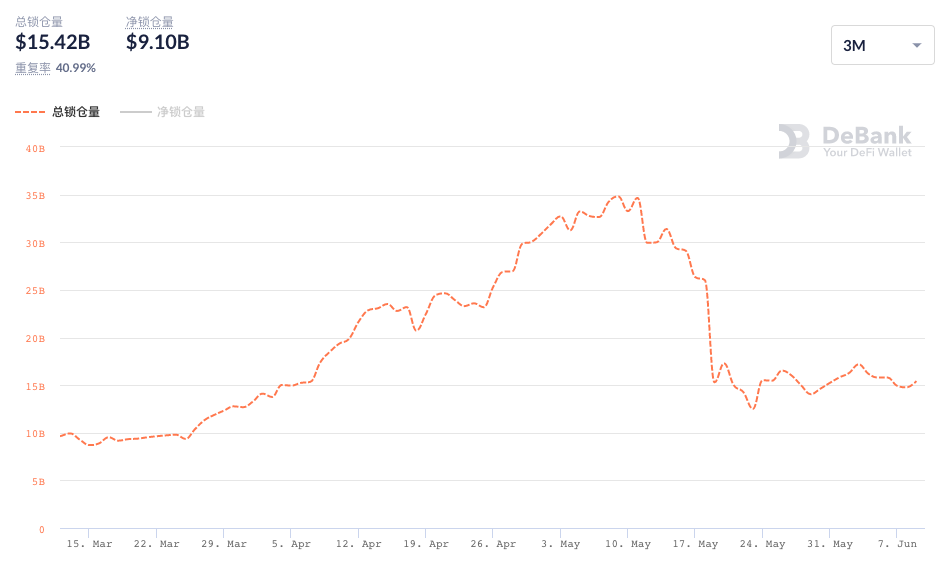
The data shows that the historical peak of BSC's TVL was 34.81 billion US dollars on May 9, and the current (June 10) TVL data is 15.42 billion US dollars, a decline of 55.7%.
It is worth mentioning that the DeFi project on the BSC chain seems to have been targeted by a certain hacker group recently, and has been attacked frequently, which will obviously have a relatively large negative impact on the TVL data of the ecosystem. At present, the BSC community has taken some targeted measures, including establishing a security alliance, planning a community white hat bounty program, establishing a SAFU fund or insurance agreement, etc. It is expected that with the gradual implementation of such measures, the ecological sentiment will pick up to a certain extent .
4. Fantom
Compared with the previous ecosystems, Fantom is earlier. However, the discussion on Fantom in the community has increased significantly recently, and we decided to select it as a major emerging public chain ecosystem.
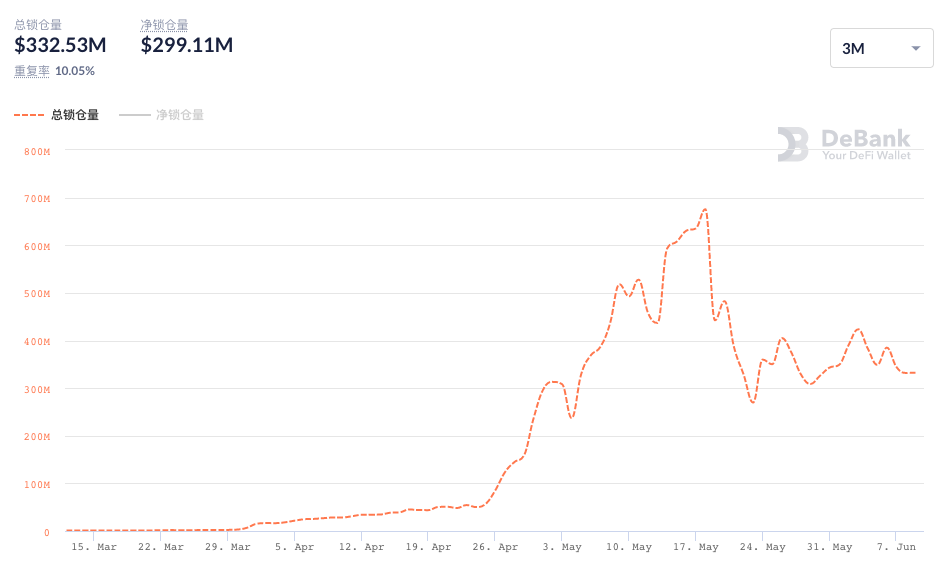
From the trend point of view, the inflection point of the TVL growth trend of the Fantom ecosystem happened to be May 19th, which can be said to have directly encountered the 519 incident. According to the data, Fantom's TVL peaked at 676 million US dollars on May 18, and the current (June 10) TVL data is 332 million US dollars, a decline of 50.9%.
5. Summary
secondary title
Comparison Dimension 2: Performance of Top DeFi Projects
To judge whether an ecology has enough vitality, the performance of leading DeFi projects must not be ignored.
At present, whether it is Polygon or the three major public chains, all parties have initially formed their own DeFi territory, and the status of leading projects is becoming increasingly stable, and the data performance is more stable than other projects in the ecosystem. Next, we will focus on the top DeFi projects within each ecology to see how the data performance of these leaders differs.
1. Polygon
Let’s look at Polygon first. With the ecological explosion in recent months, Aave, Curve, Sushiswap, 1inch, Opensea, Zapper and many other well-known projects in the Ethereum ecosystem have deployed their own Polygon versions. To choose an absolute leader in the world, Aave can be said to be doing its part.
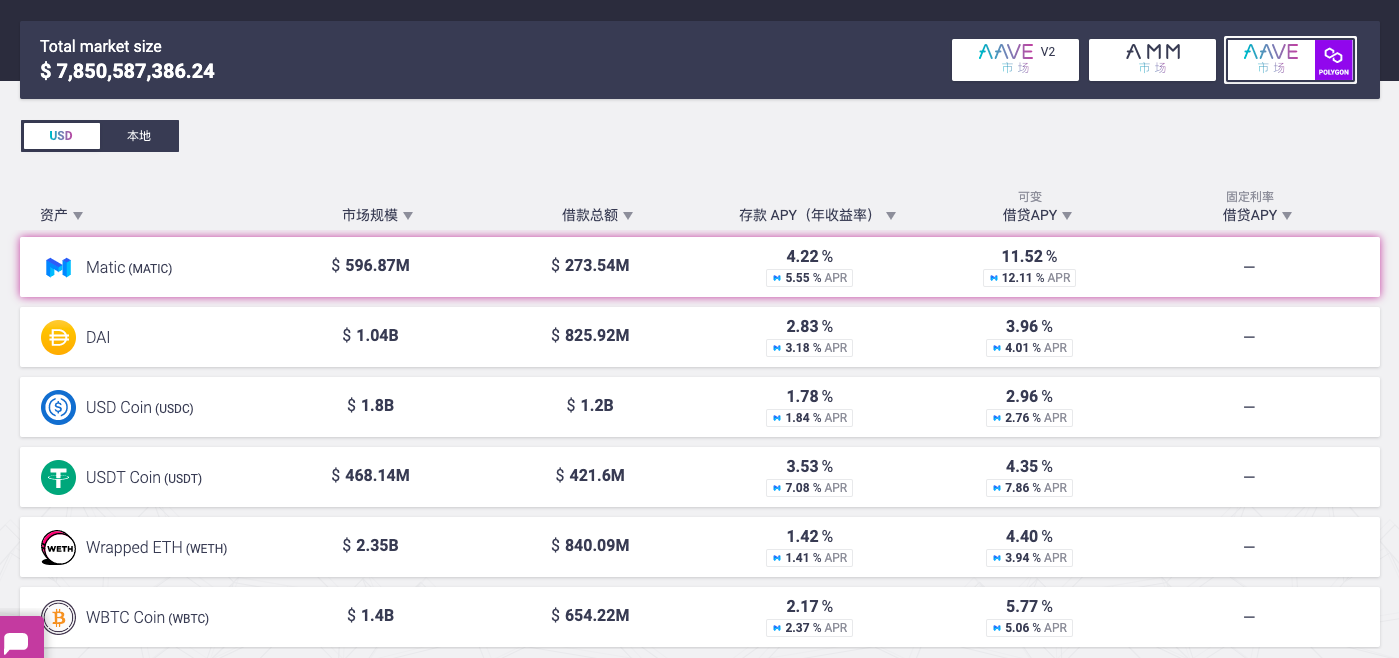
Different from the other three major ecosystems, Aave is the only loan project among the four ecological leaders to be mentioned, so it is necessary to clarify its statistical logic. The official website of the Aave Polygon version shows that the current TVL data of this product is 7.85 billion US dollars , but DeBank shows that the data is 3.56 billion US dollars. This is not a statistical error, but the official website statistics are the total deposit amount of users, and DeBank statistics are the balance after subtracting total loans from total deposits. Based on the principle of unifying data sources as much as possible , the data of DeBank is still used here.
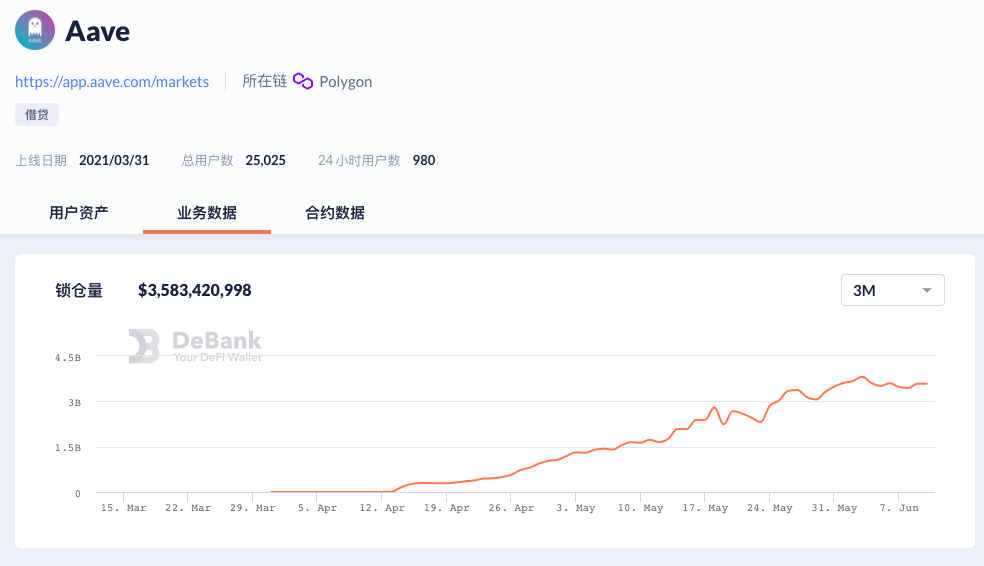
In terms of trends, similar to the overall situation of Polygon, Aave’s version of this chain basically maintains a positive trend of capital inflows. The data shows that Aave's current total lock-up volume is 3.56 billion US dollars, accounting for more than half of the TVL on the entire Polygon chain. The total number of users is 25,025, the number of 24-hour users is 1,003, and the number of 24-hour contract interactions is 142,581.
2. Solana
besides,
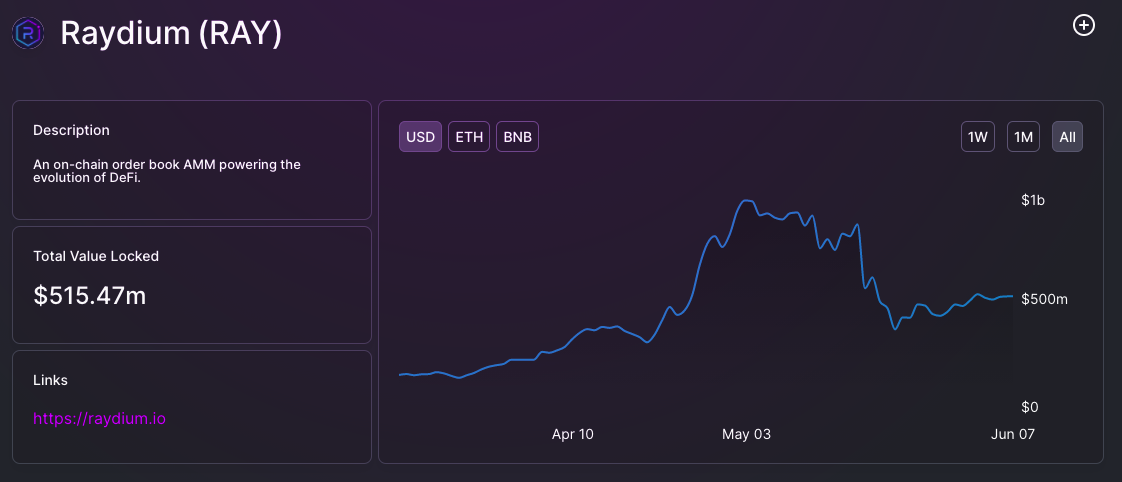
besides,Solana DailyIt also gives some specific data of Raydium yesterday.
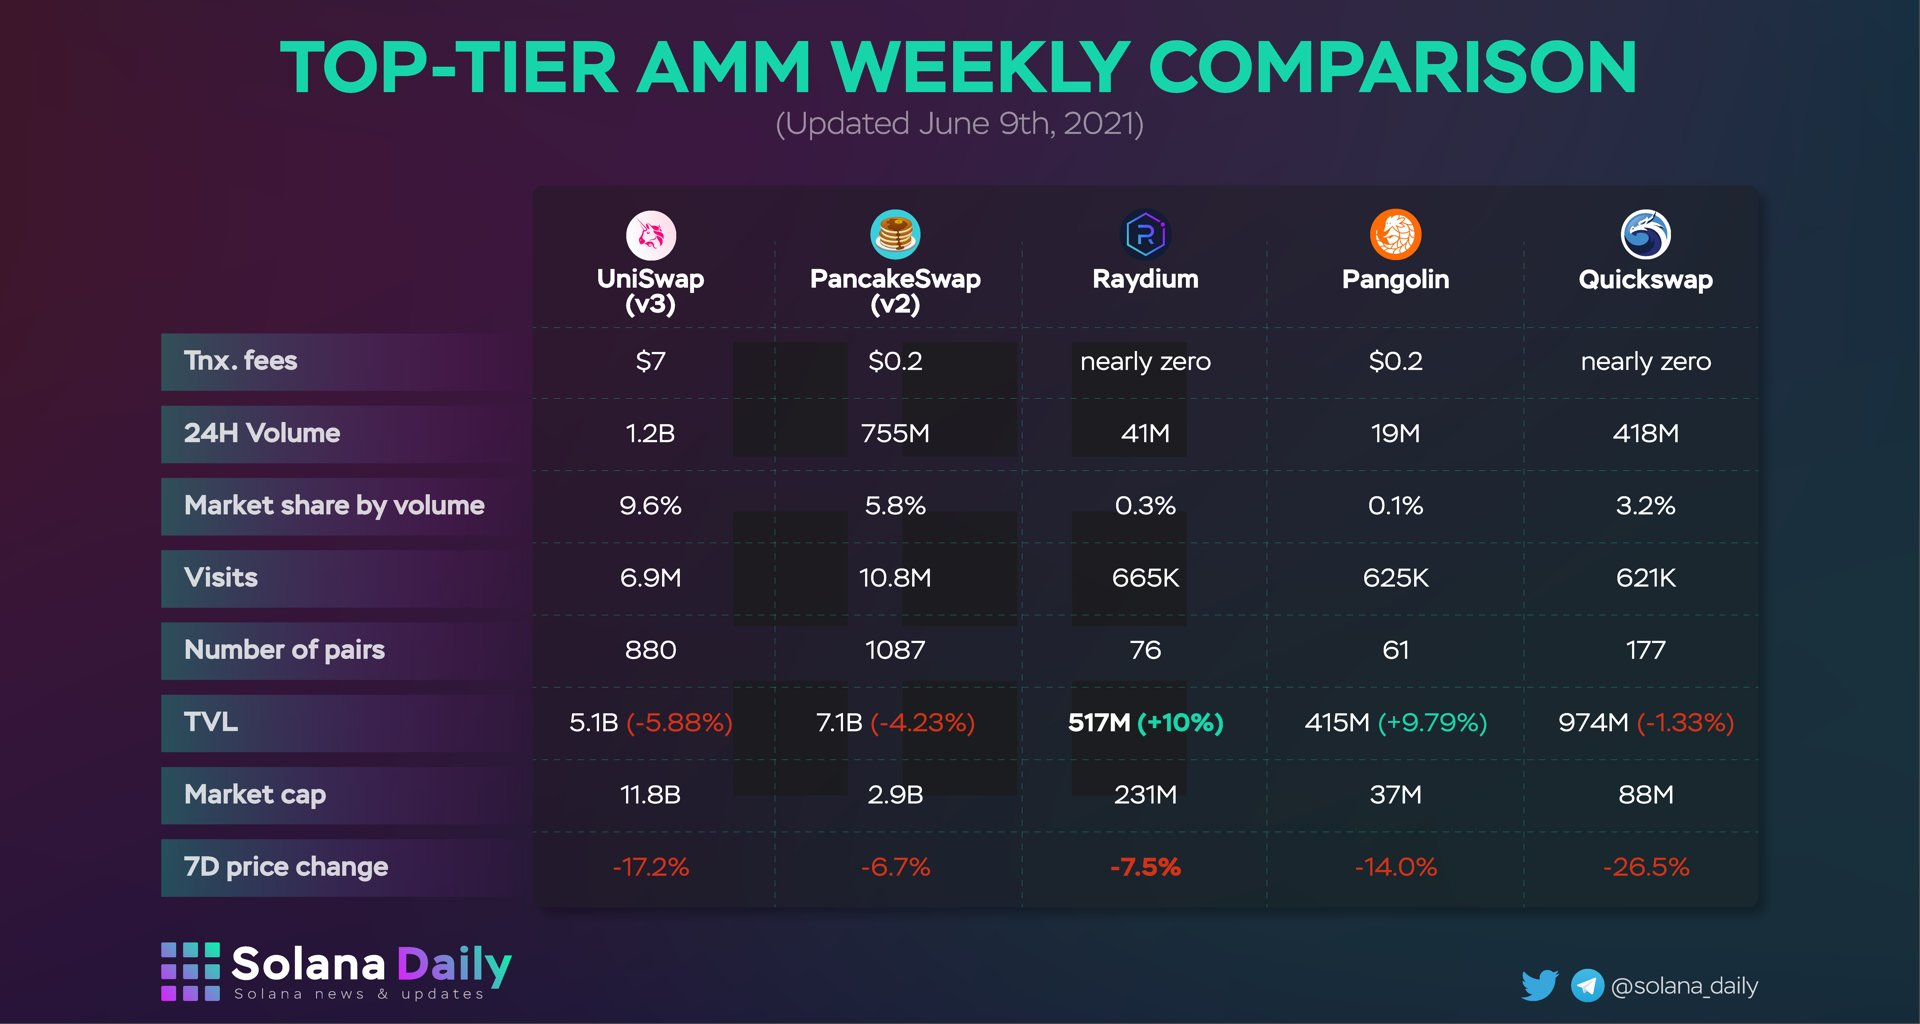
The data shows that Raydium's 24-hour transaction volume is about 41 million US dollars, and the number of visits (vistis) is 665,000 person-times. Solana Daily's chart also clearly shows the data comparison between Raydium and other ecological head DEXs including PancakeSwap.
3. BSC
The leading DeFi in the BSC ecosystem is undoubtedly the PancakeSwap just mentioned.
In terms of the data details of PancakeSwap, the data provided by DeBank is somewhat different from the data given by Solana Daily in the figure, but considering that the time periods of the two statistics do not match, the data of DeBank is still preferred.
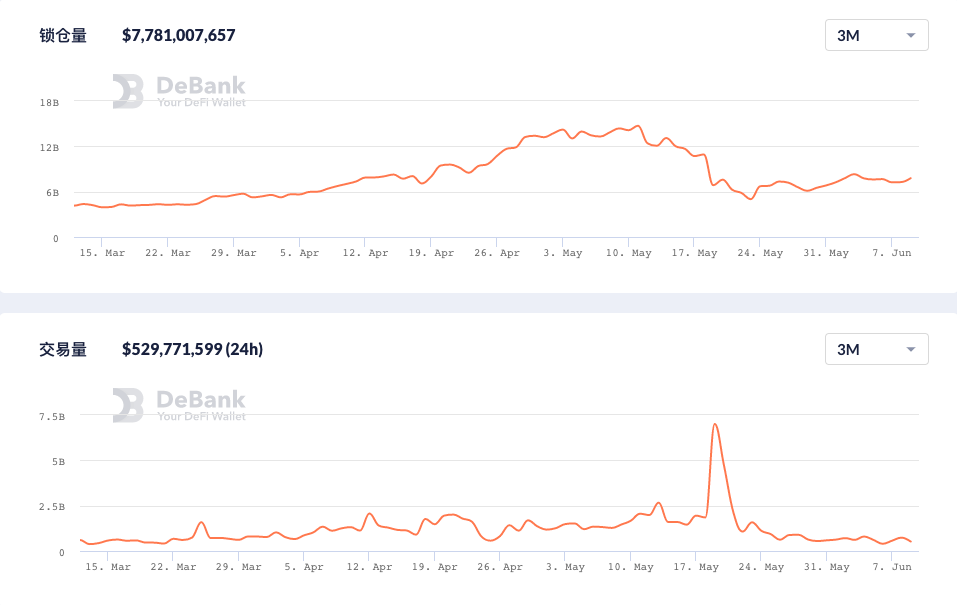
It can be seen from the trend that since mid-May, the lock-up volume and trading volume in the PancakeSwap app have declined to a certain extent. The data shows that PancakeSwap currently has a total lock-up volume of US$7.78 billion. Within 24 hours, the transaction volume is US$529 million, the number of transactions is 950,000, the number of users is 250,000, and the number of contract interactions is 3.19 million.
4. Fantom
SpookySwap, the leading DeFi project in the Fantom ecosystem, may not be well known. Like Raydium and PancakeSwap, it is also an AMM-type DEX.
It is worth mentioning that in terms of data performance, SpookySwap's current performance has a clear advantage over Sushiswap, which has integrated the Fantom ecosystem, which is also a proof of SpookySwap's strength to a certain extent.
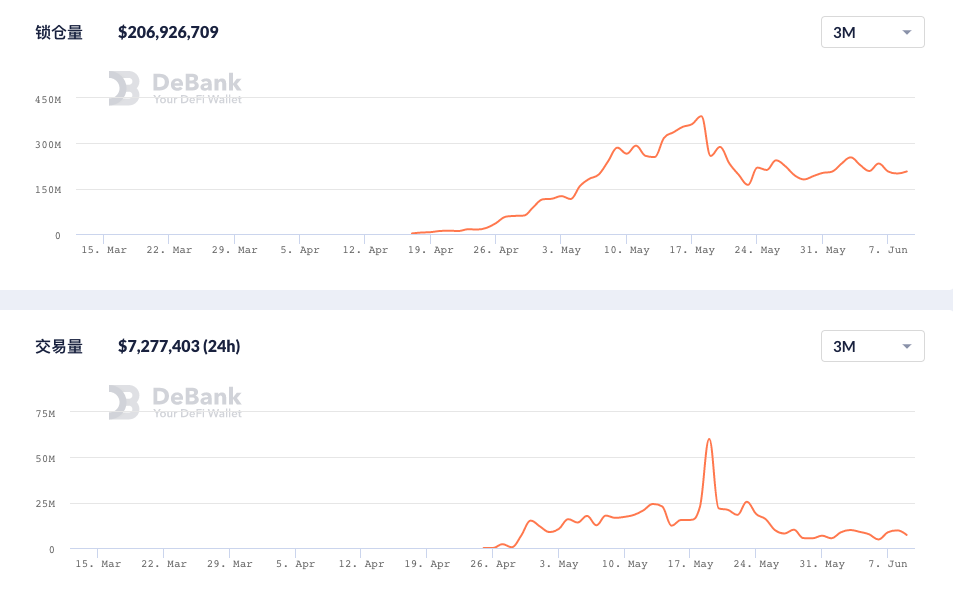
In the direction of the trend, the overall trend curve of SpookySwap in terms of lock-up volume and trading volume is closer to that of PancakeSwap. The data shows that SpookySwap currently has a total lock-up volume of US$2.06 billion, within 24 hours, the transaction volume is US$7.27 million, the number of transactions is 31,800, the number of users is 1,525, and the number of contract interactions is 175,000.
5. Summary
Judging from the performance of leading DeFi data in various ecologies, PancakeSwap, as an established DEX in the largest ecological BSC outside of Ethereum, has significantly better data performance than the other three major projects for the time being.
Although Aave's Polygon version has won a good amount of locked positions in a relatively short period of time, there is still a big difference in user activity compared with PancakeSwap, which is based on the main battlefield (BSC). In addition, although on the trend curve, the growth momentum of Aave's Polygon version is significantly better than that of PancakeSwap, which has declined to a certain extent, the MATIC token liquidity incentive provided by Polygon for Aave will begin to decay on June 14 , which will be a big variable in whether the agreement can maintain the current data level in the future.
Therefore, in this dimension, the representatives of the public chain track are currently slightly better.
The third dimension of comparison: the trend of activity on the chain
Through the application level, continue to observe the changes in the number of independent addresses on the chain, the number of daily transactions and other indicators, and can also roughly evaluate the recent development momentum of a certain ecology.
Similar to the previous article, the development team of Etherscan, the head browser of Ethereum, has now provided a unified standard browser service for Polygon, BSC, and Fantom, so here we will choose Etherscan (the name will change accordingly for different networks) as the first a data source.
1. Polygon
Let’s look at Polygon first. The two specific indicators we will observe are the number of independent addresses and the number of daily transactions. The observation period is the last two months (April 9-June 9).
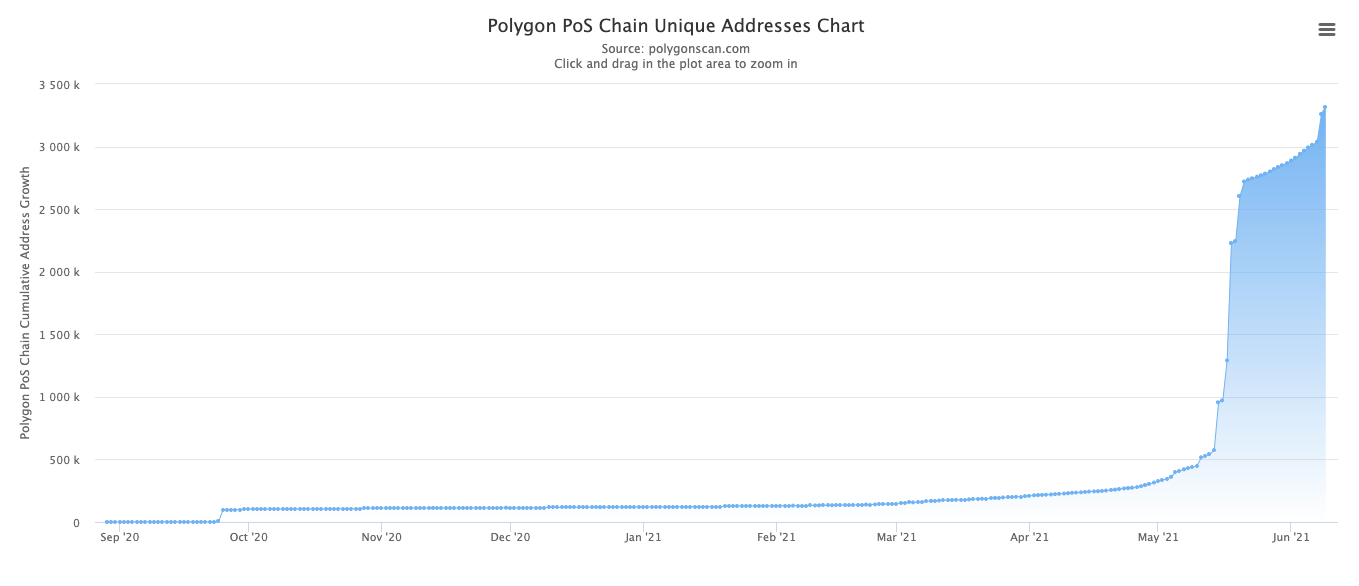
The PolygonScan chart shows that the number of independent addresses on the Polygon network has basically maintained a growth trend, but after May 21, the growth rate of this indicator slowed down to a certain extent, and the growth rate did not pick up again until June 7. On April 9, the number of independent addresses on the Polygon network was 227,265, and the number on June 9 was 3,319,869, an increase of 1360.8%.
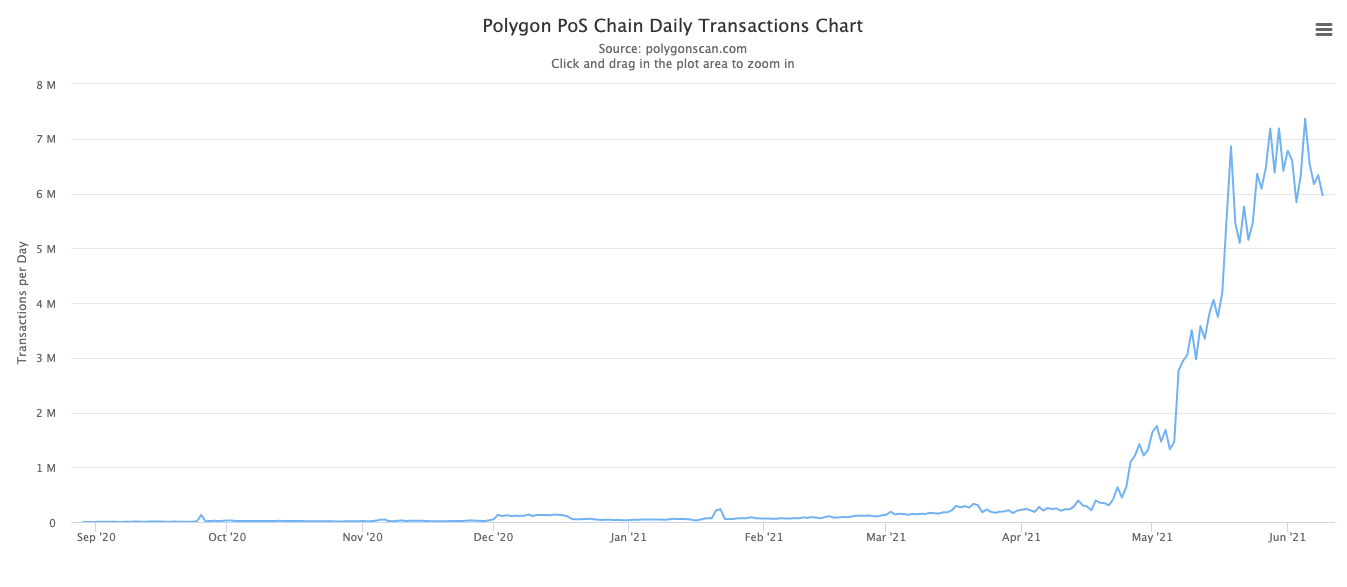
The data curve of the number of daily transactions almost maintains the same slope. Specifically, on April 9, the daily number of transactions on the Polygon network was 246,909, and the data on June 9 was 5,966,384. The overall increase in the range As high as 2316.4%; in addition, the range high point data is 7,365,885 on June 5, and the June 9 data is about 18.99% lower than the range high point
2. BSC
The last two months are obviously not the outbreak period of BSC.
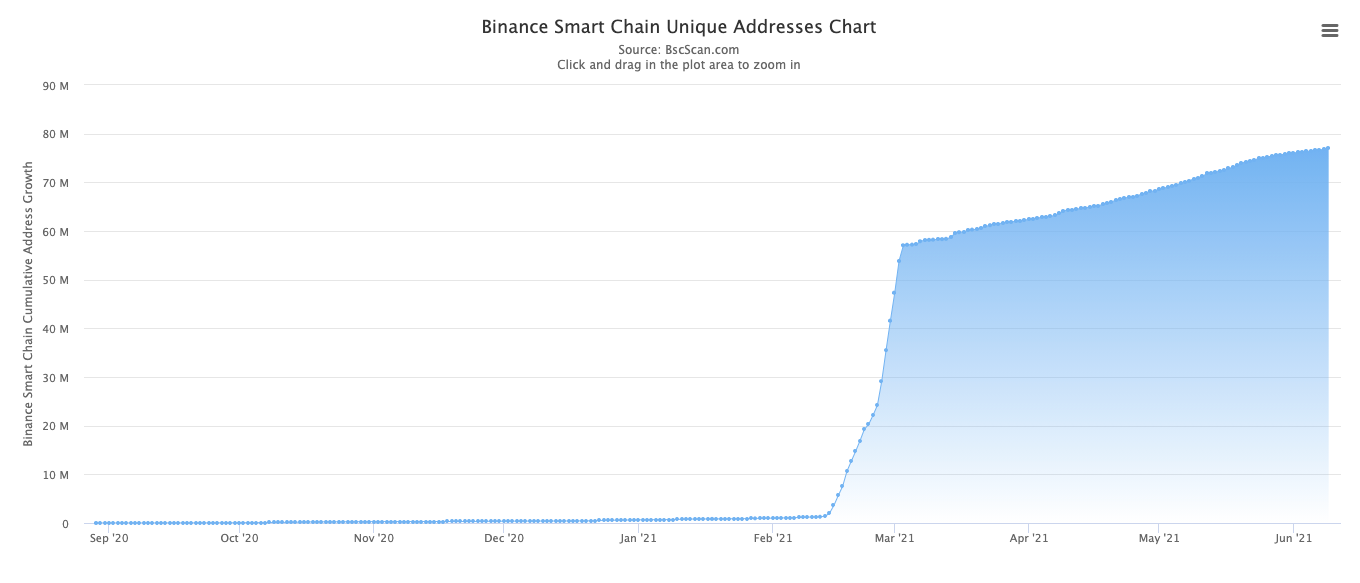
It can be clearly seen from the BSCScan chart that after the outbreak in February and March, the number of independent addresses of the BSC network has entered a stage of steady growth. On April 9, the number of independent addresses of the BSC network was 64,202,561. The number of data is 76998164, with an increase of 19.93%.
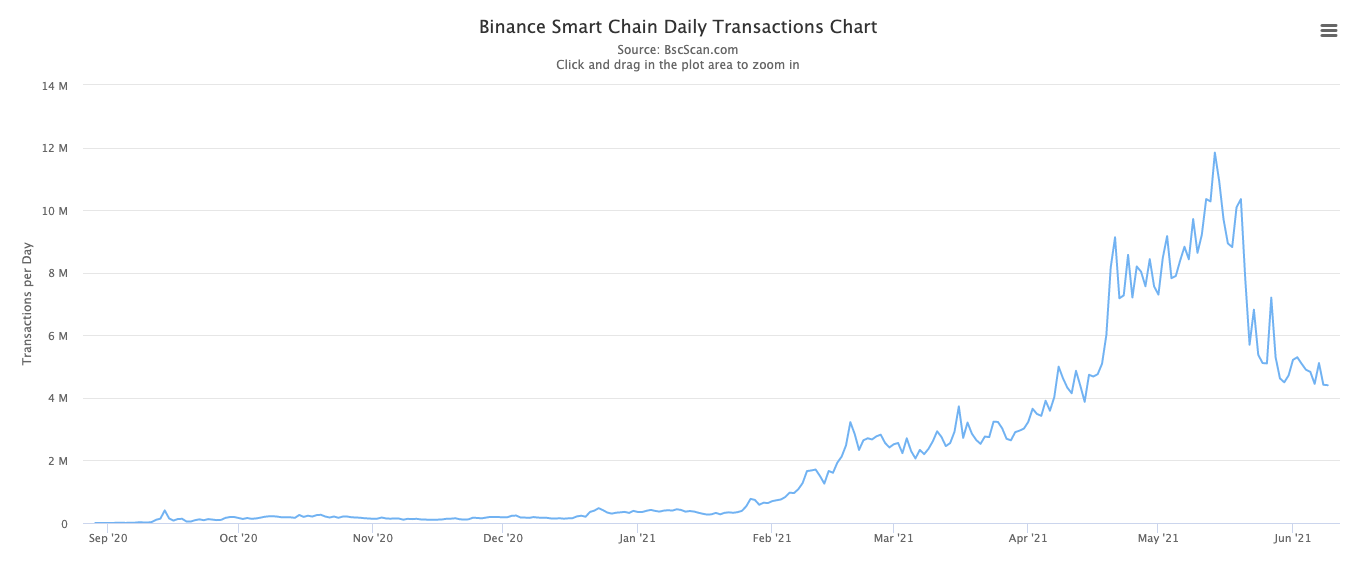
In terms of the number of daily transactions, BSC presents a completely different data curve from Polygon. Specifically, on April 9, the number of daily transactions on the BSC network was 4,626,336, and on June 9, it was 4,404,475. The overall range showed a negative growth trend, with a drop of 4.8%; in addition, the range high point data was May There were 11,281,181 transactions on the 14th, and the data on June 9 has dropped by about 60.95% from the high point of the range.
3. Fantom
Different from Polygon and BSC, the growth trend of Fantom in the number of independent addresses is relatively stable as a whole. Although there are some short-term step fluctuations, the duration does not last too long.
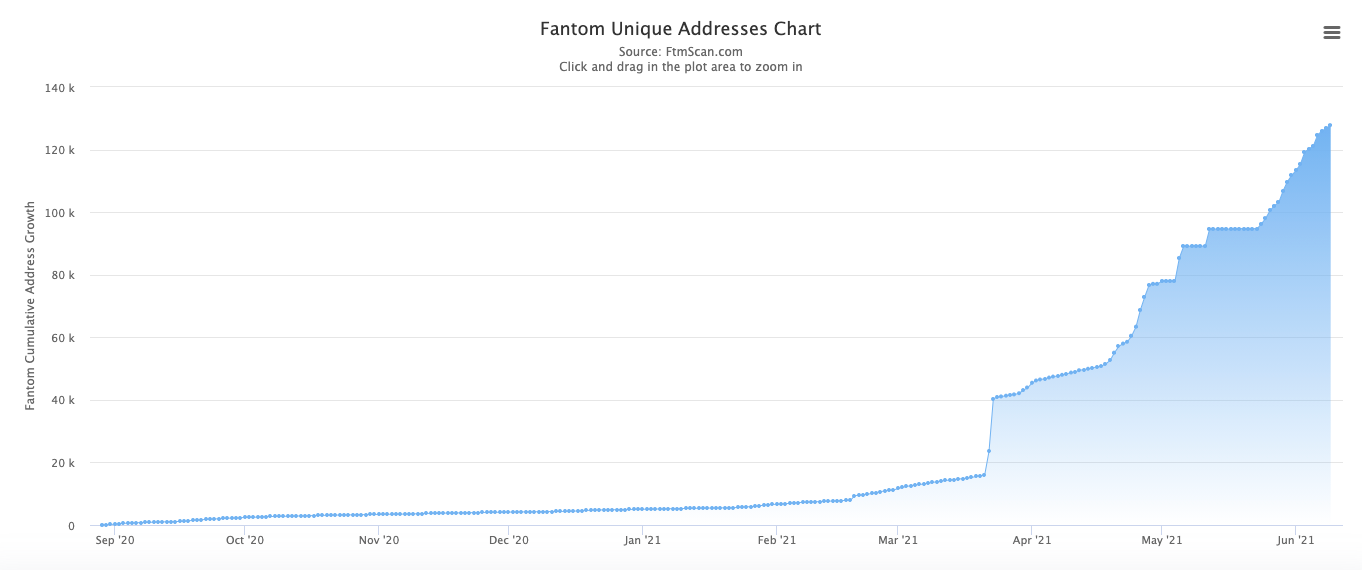
FTMScan data shows that on April 9, the number of independent addresses on the Fantom network was 48,330, and the number on June 9 was 127,801, an increase of 164.4%.
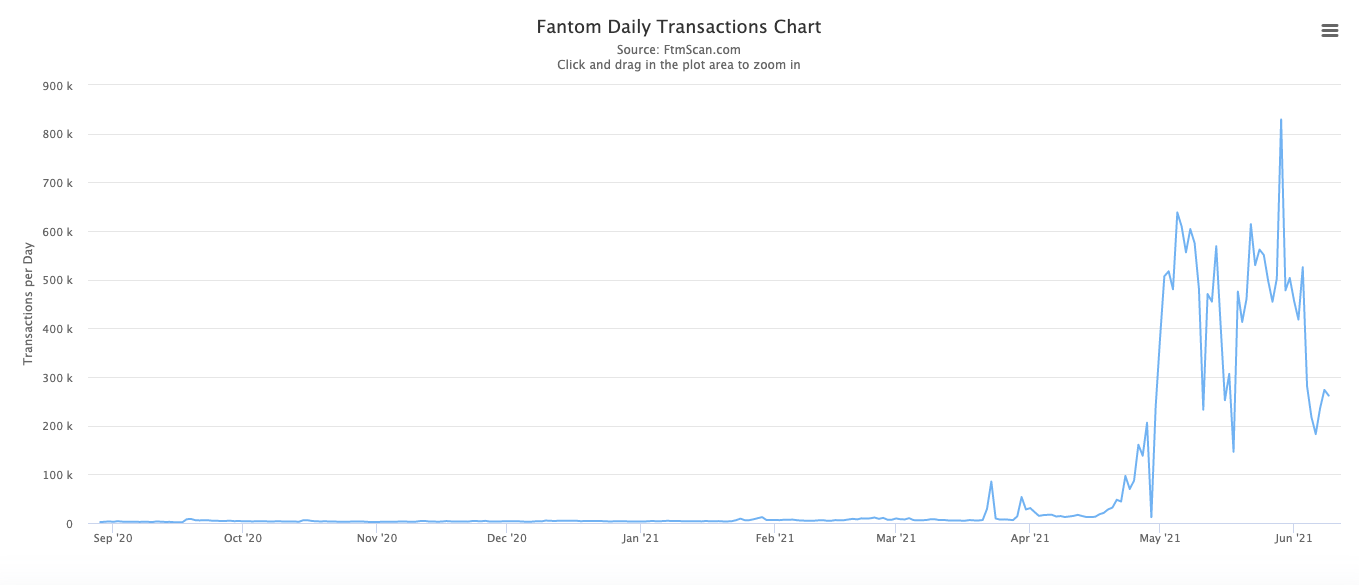
In terms of the number of daily transactions, the number of daily transactions on the Fantom network on April 9 was 12,278, and the data on June 9 was 261,804, with an overall increase of 2032.3% in the interval; in addition, the data at the high point of the interval was May 29 There were 829,036 transactions, and the data on June 9 was about 68.4% lower than the high point of the range.
5. Summary
On the whole, Polygon, as a representative of the Layer 2 track, has significantly better overall performance than BSC and Fantom, the representatives of the two public chain tracks, in terms of the trend of activity on the chain.
first level title
Is the window period of the public chain closed?
In the above, we tried to compare the data of some representative projects of Layer 2 and the public chain track through three subdivision dimensions. Before making the conclusion, we still want to emphasize again, comparing the results presented It is only the individual development trend difference of the samples, and does not fully represent the development trend difference of the entire track. Looking at the above dimensions alone, in addition to the staged differences in ecological development that will bring about completely different trends in data changes on the chain; TVL fluctuations will be largely affected by the rebound of ecological native tokens (such as MATIC) ; The performance of top DeFi projects will also vary due to the length of project operation and different incentives.
However, even through this kind of "seeing the leopard in the tube" attempt, we can roughly capture that the Layer 2 wave represented by Polygon is becoming increasingly turbulent.
Looking back at the week that just ended, Arbitrum ushered in the support of Uniswap and Sushiswap just a few days after its launch; zkSync's zk Rollup version of the EVM development work has achieved phased results, and the alpha version of the zkEVM test network has been launched; StareWare's product manager Tom Brand also mentioned that StarkNet is expected to launch the test network in the next few weeks and launch the main network later this year; although Optimism has not disclosed too many latest developments for the time being, it is getting closer and closer to its scheduled main network launch date ...
Layer 2 has become a general trend, and the individual rise of Polygon may eventually evolve into a collective outbreak of the entire track, which will attract the value that has been continuously flowing out for a long time to flow back to Ethereum, the public chain ecosystem with the strongest consensus and the largest scale. .
Therefore, external public chains will definitely face the huge challenges brought by Layer 2, and the competitive environment will be more stimulating. Public chains with relatively complete ecosystems need to first consider how to defend their own cities first, and then talk about expansion; as for other development speeds Slower, the public chain whose ecology has not yet taken shape may really not have much time left.