bitcoinbitcoinAfter changing the trough and rushing all the way to 10,500 US dollars, just when people think that Bitcoin has been singing all the way since then, and it is rushing to the generous benefits brought by the third halving, in the eyes of all beings, in a thriving In the good anticipation, despite the high point to the low point of 9,320 US dollars on February 19, 2020, people still believe that this is only a temporary small shock, a normal phenomenon before halving, as if they saw a god. However, since February 20, 2020, Bitcoin has been dragged off the altar by the devil, and it has fallen all the way to an extremely low point of 3,800 US dollars, as if returning to the end of 2018.
Whose handwriting is so strong, who made the leeks who have worked so hard for so many days and nights stunned, how many people had no sleep that night, how many people could only beat their chests and feet in the dark night?
Take back all the heartache, let's take a look at the data on the chain, the data on the chain that everyone can see, and see who is doing what from the root cause? After reading it, you may be glad that there is data on the chain.
First, look at a BTC net inflow chart <time period: 2020/1/1-2020/2/20>. Mainstream exchanges such as Binance, Huobi, OKEx, Bitfinex, and Poloniex are all included in the analysis.
It can be seen that before February 21, 2020, the BTC value of major exchanges was basically negative, which means that the exchange basically did not have much net inflow of BTC. Note that there is no net inflow of BTC is a very dangerous signal, which meansimage description。
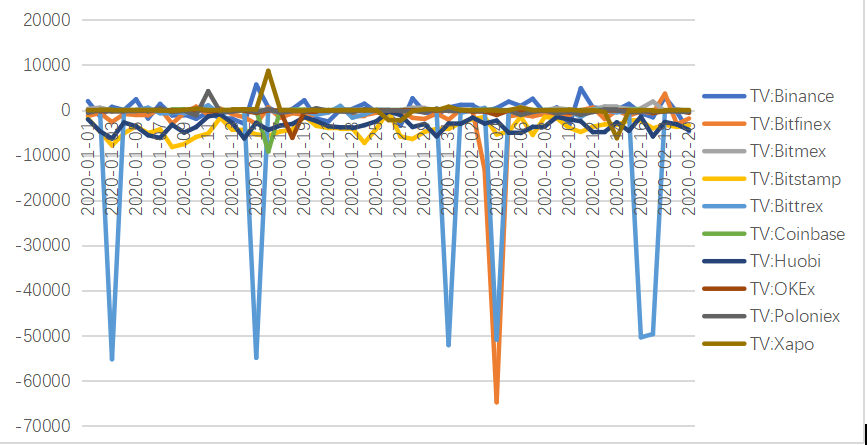
Figure 1: Exchange BTC net inflow chart <Time period: 2020/1/1-2020/2/20>
Next, let's look at the USDT net inflow chart on the exchange during the same period, most of which are in thepositive valuestatus. It also means that the exchange is flowing into USDT. Who can say that this is not a group of bullish people? What happens when there are more and more bullish people? In the capital market, the right way is to hold money in your own hands. At this time, after about 2 months of silence, Tether has stepped up the pace of printing money, allowing more and more USDT to flow into the market.
Let’s look at Tether’s money printing and circulation during the same period. In the week of February 20th, Tether newly issued 715 million. Since then, the market has become more prosperous and more active, just because people’s terrible inertial thinking”BTC enters the market to smash the market, USDT enters the market and risesimage description
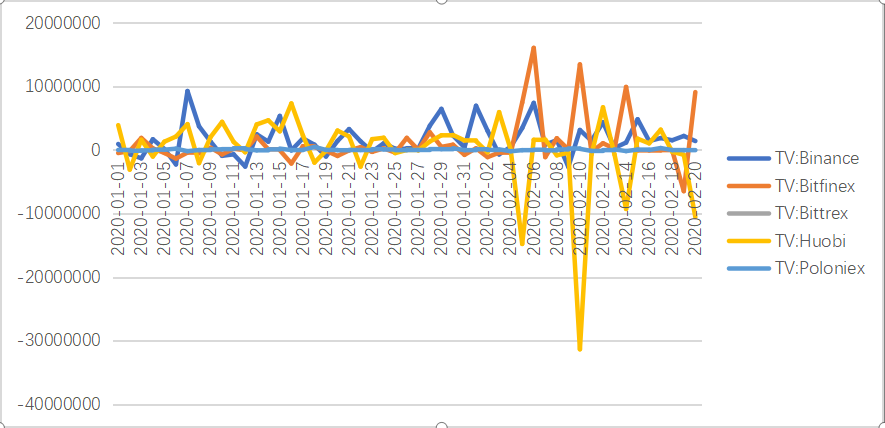
image description
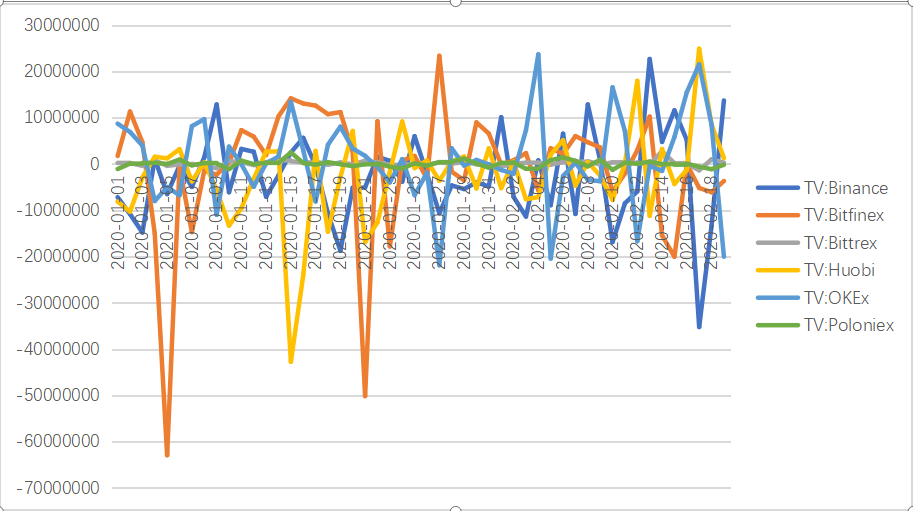
image description
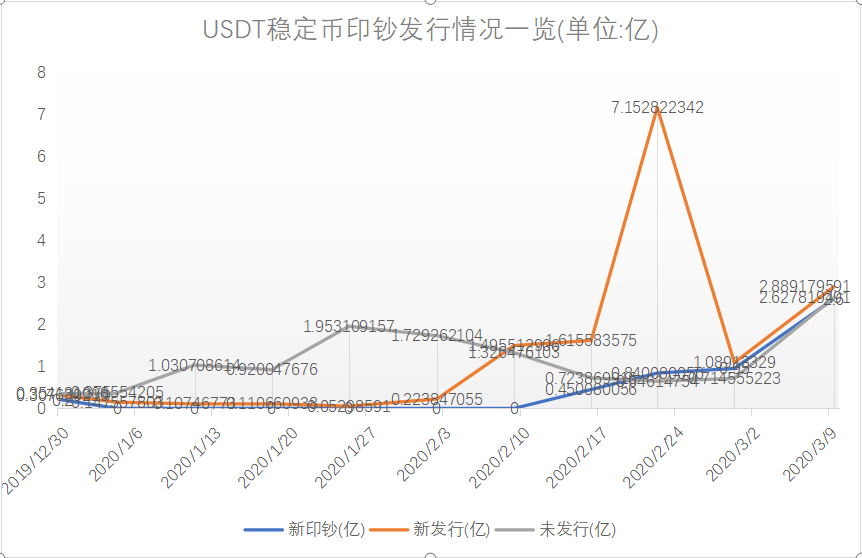
Figure 3: Tether printing and issuance <3 chains: OMNI, ETH, TRX>
The market is changing, the epidemic is breaking out, and the U.S. stock market is melting. Cash flow has never been more important than it is now.
After the time reached February 20, 2020, the market began to reverse. Let's look at the BTC net inflow chart of the exchange <time period: 2020/2/21-2020/3/14>, I believe you have begun to feel uneasy.From the 21st, a large number of BTC flooded into the exchange, and it really began to verify that "BTC entered the market to smash the market, and USDT entered the market to rise".
image description
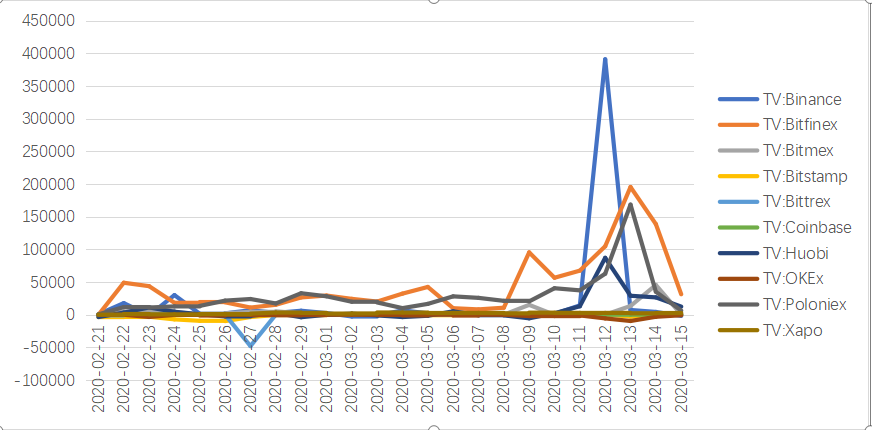
Figure 4: Exchange BTC Net Inflow Chart <Time Period: 2020/2/21-2020/3/14>
image description
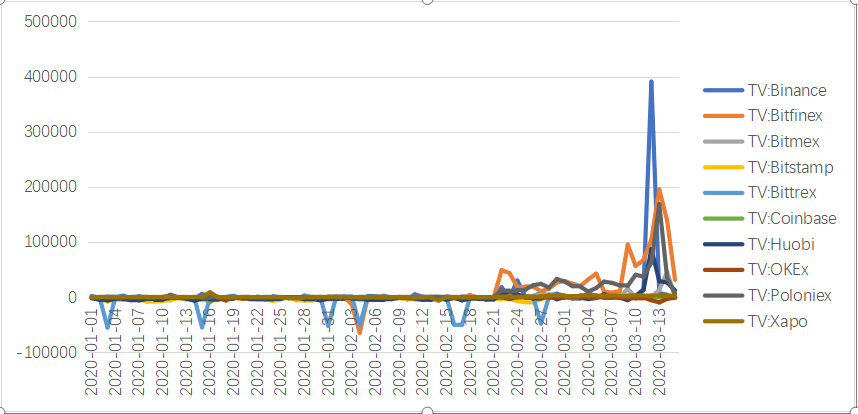
Figure 5: Exchange BTC Net Inflow Chart <Time Period: 2020/1/1-2020/3/14>
Throughout this huge decline, we can see the psychological impact of the halving market on people:Tether issued coins non-stop, and the exchange poured in a large amount of BTC as planned, smashing the market.Data on the chainData on the chain, Let you understand the loss, and let you earn thoroughly.