This article comes fromCoin MetricsThis article comes from
, the original author is Nate Maddrey and Coin Metrics, Odaily translator Christina
The distribution of wealth under traditional assets is difficult to track because people often hide their wealth and obfuscate the true amount of assets held. The emergence of encrypted assets has made wealth distribution a big step towards a more transparent direction.
As a new type of asset class, encrypted assets, with the help of blockchain technology, ensure that all transactions can be permanently recorded and will not be tampered with, and the recorded information can be tracked and queried. Since every crypto asset transaction is public and auditable, on-chain data can be used to calculate the balance held by each address on any given block. Based on this, we can look at the size distribution of the crypto asset balance held by each address. However, due to their wide distribution and anonymity, the actual use of cryptocurrencies is often difficult to assess.therefore needJudging the usage level of a particular crypto asset by looking at the "supply distribution over time"
. For example, a more dispersed supply indicates that cryptoassets are gaining practical use as a medium of exchange.
But at the same time, it should be noted that supply distribution is not the only manifestation of wealth distribution. People often create multiple addresses, and it can be difficult to determine which addresses belong to a particular individual. In addition, an address may also belong to multiple people, such as an exchange cold wallet address. Getting an accurate picture of the wealth distribution of cryptoassets requires knowing who controls which addresses.
(The analysis method used is: first determine the wallet balance of each address. Then, divide the address size according to the size of the wallet balance. The largest are those wallets that hold at least one thousandth of the total supply of assets, and the smallest are those that hold A wallet with a total supply of 1/10 billion.Secondly, these addresses are grouped into different discrete ranges according to the address size.Finally, the sum of the supply held by all addresses in each range is calculated to obtain the Percentage of total supply held.)
secondary title
What can we learn from the supply distribution?The distribution of cryptoasset supply provides a clearer window into the distribution of wealth than any asset class has seen before, and also offers some interesting insights into trading patterns. According to Coin Metrics researchers,
For assets such as BTC, ETH, XRP, and XLM, the dispersion of distribution is a potential sign of increased usage of assets, suggesting that these assets may be actually being used and eventually falling into the hands of more individual users.
Interestingly, despite efforts to make Bitcoin more useful as a medium of exchange, the supply-to-quantity indicator shows that LTC and BCH are increasingly concentrated in the hands of a few. This suggests that the wealthiest holders are hoarding more funds, or that traders are increasingly storing LTC and BCH in exchange wallets.
secondary title
methodology
methodology
First look at the balance of each address. Then, address classes are created based on different address balance sizes, ranging from relatively small to relatively large. In order to maintain consistency between different cryptoassets, we group address balances by fraction of the total supply, starting with addresses accounting for at least 1/10 billion (1/10B = 0.0000000001%) of the total Up to the address where the supply is at least one thousandth (1/1K=0.001%). As of February 2020, the total supply of Bitcoin (BTC) was 18,214,117, so one billionth of the total BTC supply is 0.0018214117 BTC, which equates to about $19.
These addresses are then grouped into discrete ranges based on size. Start with an address that can hold at least 1/10B but not more than 1/1B, then an address that holds at least 1/1B but not more than 1/100 M, and so on until it holds 1/1K or more Address (1/K+).
It should be noted that the protocol design of different blockchains is different. For example, BTC's UTXO-based supply has become more decentralized over time (every transaction on Bitcoin typically creates new addresses). However, with blockchains like Ethereum that frequently reuse addresses, this does not happen.
secondary title
Fund distribution status of eight mainstream currencies
1. Bitcoin:
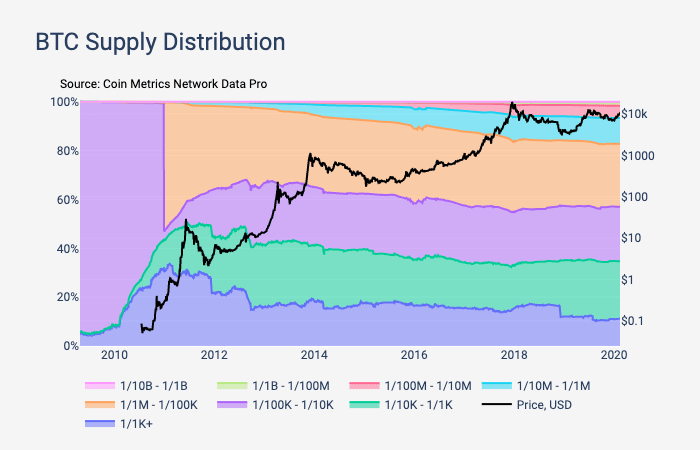
The graph in the article shows the supply held by addresses as a percentage of the total supply.
The supply of BTC is initially held by a few people, but over time it is gradually distributed to millions of different addresses.
In February 2011, the proportion of BTC supply held by large addresses (at least 1/1K of the total supply) peaked at about 33%. As of February 2020, these addresses accounted for approximately 11% of the total supply. In contrast, smaller addresses with balances of 1/10,000,000 and below have been steadily increasing their share of supply since 2011.
2. Ethereum
From the end of 2011 to the beginning of 2013, before the sharp increase in BTC price, the proportion of supply holding large addresses dropped significantly. Additionally, December 2018 also saw a drop, likely due to Coinbase reallocating its cold wallets.
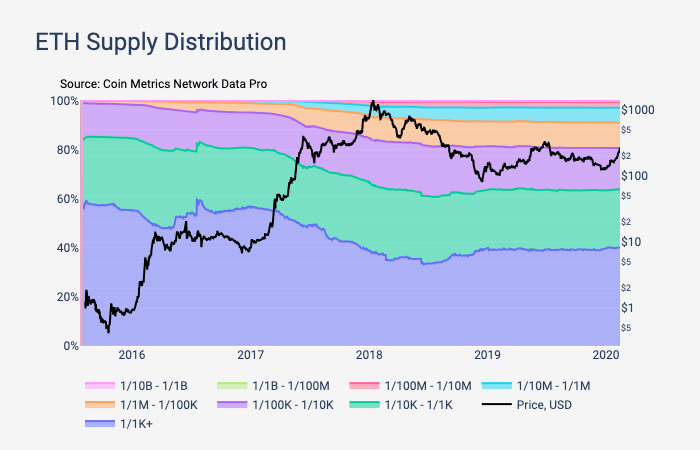
Unlike BTC, Ethereum initially distributed ETH through crowdsourcing (ICO). The supply of ETH started out highly concentrated, but gradually became more dispersed over time.
In July 2016, the percentage of supply held by addresses with the largest balances (at least 1/1K of total supply) peaked at around 60%. As the ICO bubble burst in 2017 and 2018, the holdings of these large addresses dropped significantly. As of February 2020, these addresses accounted for approximately 40% of the total ETH supply.
3. Litecoin
The proportion of supply held by relatively small addresses (1/100K of total supply and below) has been rising steadily since 2016.
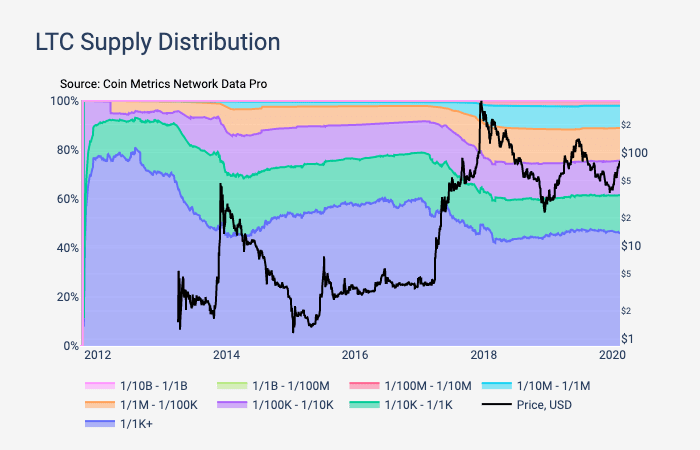
Litecoin (LTC) saw large address holdings (at least 1/1K of total supply) several times throughout 2013 before its December 2013 price spike, and throughout 2017 before its January 2018 price peak Dropped significantly. Interestingly, nearly 46% of the supply is still held by large long-term capital accounts, compared to just 11% for large Bitcoin accounts.
4. Bitcoin Forks
Unlike BTC, the supply of Bitcoin Cash (BCH) held by large addresses is more concentrated over time, which also means wealth is more concentrated.
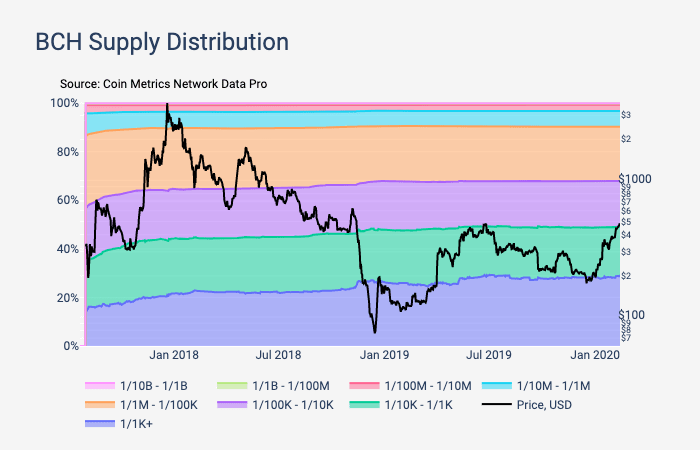
In August 2017, when BCH was forked from BTC, about 14% of the BCH supply was held by large addresses with a balance of at least 1/1K of the total supply. But as of February 2020, large addresses accounted for about 29% of the total BCH supply, which is an increase from the 14% allocation at the time of the 2017 fork.
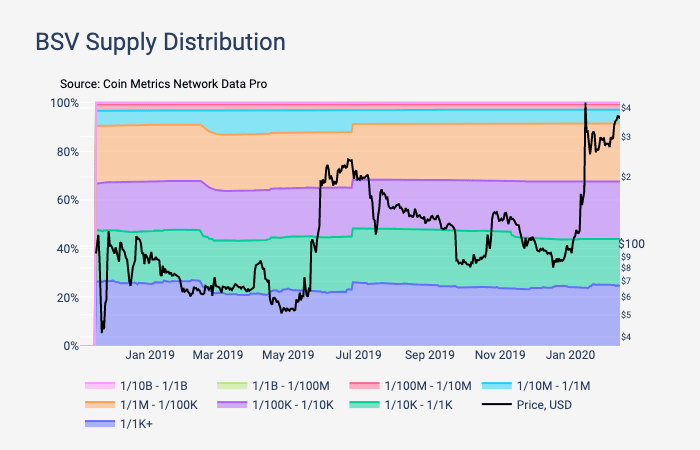
5. Ripple and Stellar
Among BSV holders, the proportion of supply held by addresses with a balance of at least 1/1K has remained relatively flat except for a significant drop in February 2019 and a sudden increase in June 2019. BSV's distribution is actually slightly smaller than when it released its hard fork in August 2018. In August 2018, when BSV forked from BTC, these large addresses accounted for 26% of the BSV supply. As of February 2020, they held about 24%.
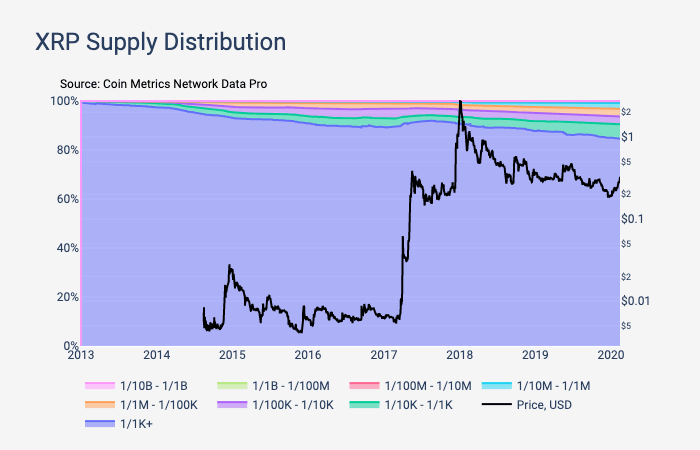
Both Ripple (XRP) and Stellar (XLM) are account-based public chains, and both have official foundations that maintain a large percentage of holdings. 85% of the total XRP supply is held by addresses (at least one-thousandth of the total supply), and the distribution of wealth is concentrated. The fact that these organizations hold such a large percentage of the circulating supply has also been criticized.
6. Tether
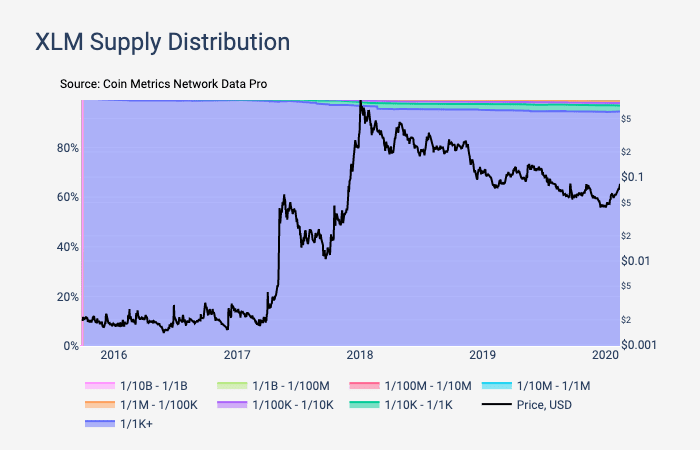
95% of the total XLM supply is held by addresses representing at least 1/1K of the total supply. This is mainly because the Stellar Development Foundation (SDF) holds more than half of all XLM. It currently holds 2.94 billion XLM as mandated by the SDF. Additionally, SDF recently burned 50% of the total XLM supply, bringing its supply down to 50B. These burned XLMs still appear on-chain because they were sent to the burn address and are therefore considered part of the supply distribution.
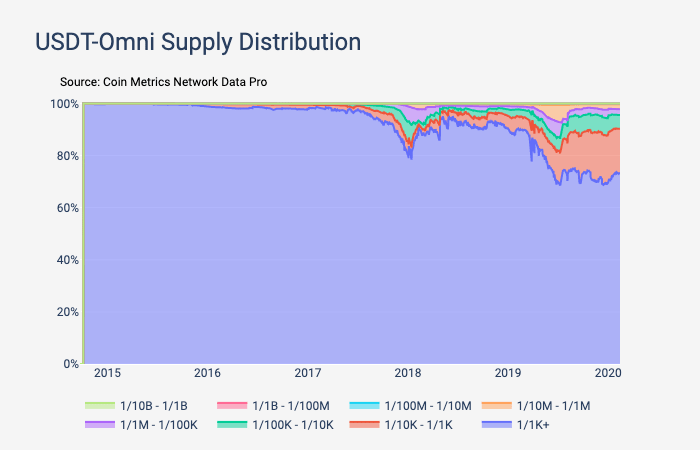
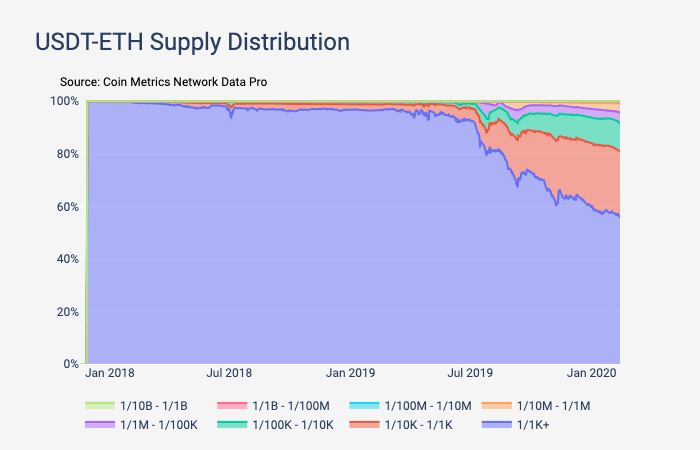
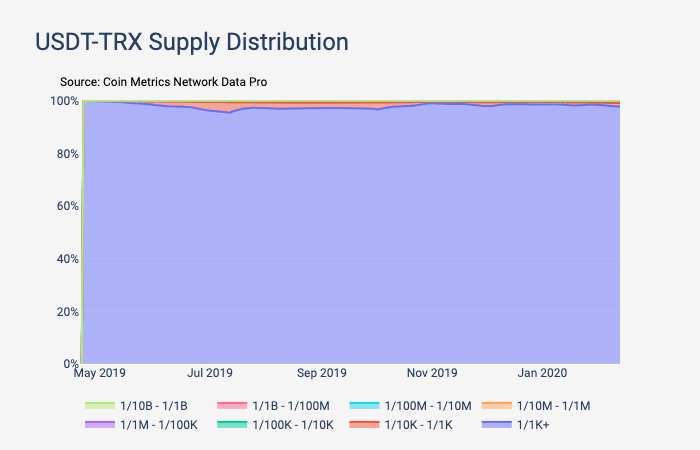
As the largest stablecoin, Tether has issued tokens on multiple blockchains. Among them, we mainly looked at the Omni (USDT Omni), Ethereum (USDT-ETH) and Tron (USDT-TRX) versions of Tether.
All three versions of Tether started out as 100% centralized. However, over time, USDT-Omni and USDT-ETH have become more widely distributed. indicating that they are being used as a medium of exchange, it is not difficult to explain why supply is flowing from addresses with larger balances to addresses with smaller balances. However, Tron’s version of Tether (USDT-TRX) has maintained almost 100% centralization, suggesting that its usage as a medium of exchange may not be too high (Tether was only launched on Tron in May 2019, however) .